Boris Tane
What even is code mode?
Explore with AI
Code mode is a simple idea: instead of asking a model to call tools one at a time, you give it a single tool that runs code, and you expose all the other tools as functions it can call from that code. The model writes a small program, the program calls the tools, and only what the program returns goes back to the model.

graph TB M["Model"] -->|"writes a script"| C["Code tool"] C --> T1["GitHub"] C --> T2["AWS"] C --> T3["Sentry"] T1 ~~~ R T2 ~~~ R T3 ~~~ R C -->|"only the return value"| R["Model"] style C fill:#d1fae5,stroke:#6ee7b7,color:#065f46
Over the last year, code mode has mostly been discussed as a better way to use MCP servers. This framing undersells it. Code mode has nothing to do with MCP, it’s a decision about where tool results go: either into the model’s context, or into the variables of a program the model wrote. Any agent can make that decision, and at Polylane, our agent makes it for most of its tool calls.
Tool calling
In most agents, tool calling works the same way:
- the model asks for a tool
- the harness runs it
- the full result is appended to the conversation
The model reads the whole array of messages again, decides what to call next, and the loop goes round again.
Let’s say you’re using a coding agent and ask it why CI is failing on main. It calls the GitHub API, lists the last 15 workflow runs and gets back 15 full run objects. It then picks the failed ones from within its context, and makes multiple sequential tool calls, asking for the jobs of each failed run, one at a time.


Every tool call is a full inference step, and every payload stays in the context for the rest of the conversation. The model only needed the run ID, the commit and the name of the failing job, but it paid for everything else too. In this setup the model is the glue between the tools, and it’s a very expensive glue.
Code mode
With code mode, the glue is code the model writes. The same question becomes a single script:
// Simplified, modelled on scripts our agent writes.
async () => {
  const { data } = await tools.githubApi({
    method: "GET",
    path: "/repos/{owner}/{repo}/actions/runs",
    params: { owner: "acme", repo: "web", branch: "main", per_page: 15 },
  });
  const failed = data.workflow_runs.filter((r) => r.conclusion === "failure");

  return Promise.all(
    failed.map(async (run) => {
      try {
        const jobs = await tools.githubApi({
          method: "GET",
          path: "/repos/{owner}/{repo}/actions/runs/{run_id}/jobs",
          params: { owner: "acme", repo: "web", run_id: run.id },
        });
        return {
          id: run.id,
          sha: run.head_sha.slice(0, 7),
          failedJobs: jobs.data.jobs.filter((j) => j.conclusion === "failure").map((j) => j.name),
        };
      } catch (e) {
        return { id: run.id, error: String(e) };
      }
    }),
  );
};
The tool results land in variables instead of the context. The script filters the runs, fetches the jobs of the failed ones in parallel, and returns a handful of fields per run. That return value is the only thing the model sees.
This is not only cheaper, it’s also faster. With tool calling, the model takes a full inference step for every call, and at each step it reads, and reasons about, a growing dump of JSON it mostly doesn’t need. With code mode, it writes one script, the calls inside it run in parallel, and the model gets its answer back from a single tool call. Fewer steps, less to read at each step, and less reasoning about irrelevant fields.
Code mode is also not limited to JavaScript. Any language that can be interpreted in an isolated environment works, and many agent frameworks use Python instead: the model writes a Python function that calls the tools, and the environment runs it.
Where does the code run?
The beauty of code mode is that the model can write and execute arbitrary code. The scary part of code mode is that the model can write and execute arbitrary code. That code has to run somewhere it can’t do any damage.
Polylane’s agent has a tool called executeCode for this. Its only input is a string of JavaScript: an async function, like the script above. When the model wants to use code mode, it calls executeCode like any other tool:
{
  "name": "executeCode",
  "input": {
    "code": "async () => { const { data } = await tools.githubApi({ ... }); return data.workflow_runs.length; }"
  }
}
Inside that code, the model has access to a single global object called tools. It has one async function per tool the agent can use, and each function takes the same input as the tool and returns its result:
// What the model can call from inside a script.
await tools.githubApi({ method: "GET", path: "/repos/{owner}/{repo}/pulls", params: { owner: "acme", repo: "web" } });
await tools.vercelListDeployments({ projectId: "prj_123", limit: 10 });
await tools.awsCloudWatchLogs({ action: "query", logGroupNames: ["/aws/lambda/checkout-api"], queryString: "..." });
await tools.sentryIssues({ action: "get", issueId: "4512" });
Each script runs in a fresh V8 isolate from Dynamic Cloudflare Workers, with no network access at all. This is how executeCode starts one, trimmed:
const executor = new DynamicWorkerExecutor({
  loader: env.LOADER,
  timeout: EXECUTION_TIMEOUT_MS,
  globalOutbound: null, // fetch() and connect() throw inside the isolate
});

const { result, logs, error } = await executor.execute(code, [provider]);
The isolate has no network, so how does tools.githubApi() reach GitHub? That’s what the provider is for. It’s built outside the isolate, in a regular Cloudflare Worker, and maps every tool name to a function that runs the real tool:
// Simplified: one function per tool, running in a regular Worker, not in the isolate.
const provider = {
  name: "tools",
  fns: Object.fromEntries(Object.entries(agentTools).map(([name, tool]) => [name, (input) => tool.execute(input)])),
};
Inside the isolate, tools only holds stubs with the same names. When the script calls tools.githubApi(input), the stub sends the name and the input over RPC to that regular Worker, which runs the real githubApi tool with the workspace’s credentials, and the result is sent back into the isolate. The only way the script can reach GitHub is through that tool, and it never sees a token.
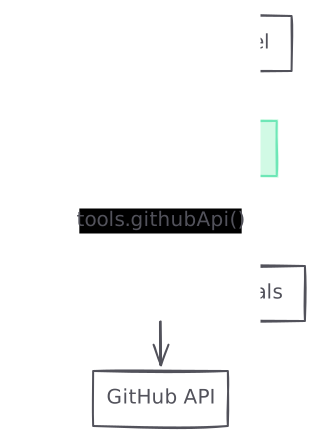
graph TB M["Script from the model"] --> I["Isolate, no network"] I -->|"tools.githubApi()"| A["Worker, with credentials"] A --> G["GitHub API"] style I fill:#d1fae5,stroke:#6ee7b7,color:#065f46
An isolate starts in a few milliseconds, so there’s no pool of isolates to keep warm. Every script gets a new one, and it’s thrown away as soon as the script returns.
You don’t need Cloudflare for this
We run code mode on Cloudflare because the rest of Polylane runs there, and isolates are a very good fit for it. But all you need is an isolated environment that can run code without network access, and a way to pass your tools into it. There are plenty of options, including:
- Claude’s programmatic tool calling. The Claude API has programmatic tool calling: Claude writes code that runs in Anthropic’s sandbox, and each call to one of your tools pauses the script and comes back to your application as a normal tool call.
- pctx. pctx is an open source code mode server: it sits in front of your MCP servers and runs the generated code in a Deno sandbox that can only reach the hosts you allow.
- Pyodide in Deno. Pydantic’s mcp-run-python runs Python with Pyodide inside Deno, isolated from the host.
- QuickJS in WebAssembly. quickjs-emscripten gives you a small JavaScript engine in WebAssembly that you can embed in any Node.js process, with no network and no file system unless you pass them in.
Code mode is not about MCP
Early implementations of code mode focused on converting MCP servers into TypeScript APIs, which is why most people think of code mode as a better way to use MCP. But if you look at what the isolate actually needs, it’s a list of functions with their types, and a way to call them. MCP is one source of those functions. The agent’s own tools are another, and for most agents they are by far the bigger one.
That’s how we use it. Polylane connects to everything you run in production: your clouds, your observability tools, your code, your error tracking, etc. It investigates production issues and opens pull requests to fix them, and every provider it connects to comes with its own tools. That adds up to a few hundred tools, and describing all of them in full in the prompt would take close to 300,000 tokens before the conversation even starts.
Tool descriptions in the prompt
None of these tools go through MCP on their way into executeCode. They’re the agent’s own tools, passed into the isolate as functions.
How Polylane uses code mode
The prompt is an index, not a manual
Putting every tool signature in the prompt would cost more context than code mode saves. So we don’t. When we build executeCode’s description, we generate a TypeScript declaration of the tools object with just the name of each tool and a one-line summary taken from its description:
// Part of the tool index in executeCode's description.
declare const tools: {
  awsCloudWatchLogs: ToolFn;
  datadogSearchLogs: ToolFn;
  sentryIssues: ToolFn;
  vercelListDeployments: ToolFn;
  // more tools, each with a one-line summary (omitted here)

  /** Look up instructions and TypeScript input/output types for tools by name. */
  __describe: (names: string[]) => Promise<Record<string, { input: string; output: string; description?: string }>>;
};
Looking up a tool with tools.__describe
For every tool, the model needs to know their input and output schema. tools.__describe is a function in the isolate like any other tool: it takes a list of tool names and returns their input type, their output type and their full instructions. The model usually calls it in a first script, reads the types, and writes the real script in the next step:
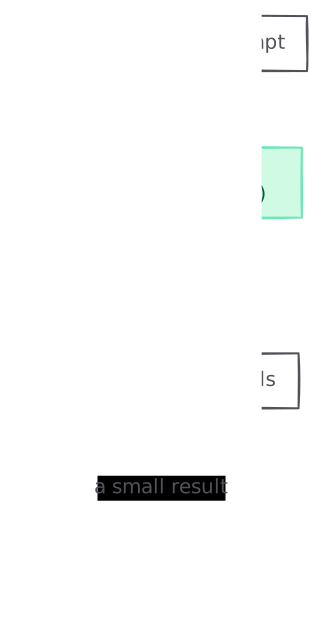
graph TB I["Tool index in the prompt"] --> D["Script 1: tools.__describe([...])"] D -->|"input and output types"| W["Script 2: calls the tools"] W -->|"a small result"| M["Model"] style D fill:#d1fae5,stroke:#6ee7b7,color:#065f46
Here’s what the model gets back for vercelListDeployments:
await tools.__describe(["vercelListDeployments"]);

// {
//   vercelListDeployments: {
//     input: "{ projectId?: string; limit?: number; sinceMs?: number }",
//     output: "{ items: Array<{ uid: string; projectId: string; target: null | string; state: string; url: string;
//               branch: null | string; sha: null | string; createdAt: number; ready: number }>; count: number }",
//     description: "List recent Vercel deployments for a project (or across the team) ... ",
//   }
// }
The output type matters as much as the input type. With plain tool calling, the model reads whatever comes back and figures out its shape. In code mode, it has to write items.filter((d) => d.state === "ERROR") before it has seen a single result, so it needs to know that items and state exist. We generate output types for our tools at build time for exactly this reason.
Teaching the model to write defensive scripts
The last piece is the instructions in executeCode’s description. A tool call that throws inside a script throws for the whole script, unless the model catches it, so the description tells the model to wrap every tool call in its own try/catch, and to run independent calls with Promise.all:
// The fan-out pattern the description asks for: partial results instead of one failure losing everything.
await Promise.all(
  items.map(async (it) => {
    try {
      return { it, data: await tools.someTool(args) };
    } catch (e) {
      return { it, error: String(e) };
    }
  }),
);
It also tells the model to never return a raw API payload: pick the fields you need, aggregate inside the isolate, and return a summary.
What the data says
We record every tool call our agent makes in our data lake, tagged with how it was called, either as a direct tool call or through code mode. I’m using data from the past 30 days to illustrate how code mode changes the behaviour of agents. Almost all of those calls were made by the same model, so this shows how code mode behaves in our setup, not how models compare with each other.
More than 70% of the agent’s tool calls ran inside executeCode, and that share was pretty stable throughout the 30 days.
Most code mode scripts don’t fan out very far: a typical script makes two or three tool calls. Almost a third of them make a single call, which sounds like a waste of code mode until you look at what they do.
They call one tool and do the filtering in code, because the model knows it only needs a few rows out of a large payload. Logs are the typical case. Here’s a script our agent wrote during an investigation. It asks for the error count of every distinct error message over a week, then throws away the rows that aren’t real errors (request lines, stack frames, generic “exception” messages) before returning anything:
async () => {
  const r = await tools.cloudflareRunTelemetryQuery({
    datasets: ["cloudflare-workers", "otel"],
    timeframe: { reference: "2026-11-01T16:45:00Z", offset: "-7d" },
    view: "calculations",
    filters: [{ key: "$metadata.level", operation: "eq", type: "string", value: "error" }],
    calculations: [{ operator: "count", alias: "n" }],
    groupBys: [
      { type: "string", value: "$metadata.service" },
      { type: "string", value: "$metadata.message" },
    ],
    orderBy: { value: "n", order: "desc" },
    limit: 300,
  });
  const rows = (r.calculations?.[0]?.aggregates || []).map((g) => ({ g: g.groupKey, n: g.value }));
  const isUrl = (s) => /^(GET|POST|PUT|DELETE|PATCH|HEAD) https?:/.test(s);
  const noise = (s) => s === "exception" || s.endsWith(" ERROR") || s.startsWith("    at ");
  const real = rows.filter((x) => {
    const m = x.g.split(" ⬤ ")[1] || "";
    return !isUrl(m) && !noise(m);
  });
  return { totalRows: rows.length, real: real.slice(0, 60) };
};
One tool call, up to 300 groups of log messages in, and the 60 most frequent real errors out. With a direct tool call, all 300 rows would have landed in the model context, and the model would have done the same filtering using inference.
The scripts that make no tool calls at all are pure computation, like parsing a log line, date arithmetic, or reshaping JSON the model already has.
Across all scripts, the difference in context is large. Only a small fraction of the tool output produced inside scripts made it back to the model, and even the scripts that called 50 tools or more returned about 1,700 tokens each on average.
Failures are cheaper inside code
Calling third-party APIs from tools can fail, and most harnesses have a lot of plumbing to recover from this. What matters is what a failure costs. A failed direct call costs a full round trip: the model reads the error, thinks about it, and tries again. A failed call inside a script is a catch block. More than 95% of the failed calls inside scripts happened in a script that still finished and returned a result, with the error sitting next to the items that succeeded.
Overall, code mode scripts ran with a 98.8% success rate, which means the model has to reason about far fewer tool failures.

graph TB D["Direct call fails"] -->|"error in context"| DM["Model step to recover"] S["Call in a script fails"] -->|"caught"| SC["Script carries on"] SC -->|"results and errors together"| SM["One model step"] style DM fill:#fee2e2,stroke:#fca5a5,color:#7f1d1d style SM fill:#d1fae5,stroke:#6ee7b7,color:#065f46
What other agents do
We have an MCP server that gives coding agents access to everything Polylane can access (logs, metrics, traces, the context graph, etc.) from a single MCP server instead of connecting all providers MCPs. For instance, if you use Claude Code, your agent can reason about your Cloudflare Workers and your Vercel projects through the same MCP server.
Our MCP server offers coding agents both options: either call tools directly with a runTool tool, or use runCode to execute arbitrary JavaScript against the same tools. Over the same 30 days, most coding agents chose to write code when they had the choice. Codex is the exception, it mostly calls tools one by one.
For the agents that use both options a lot, calls made from code failed about as often as direct ones, and in Amp’s case far less often.
Amp
Claude Code
Codex
Where code mode falls short
Code mode isn’t free, and we’ve hit most of its edges:
- Writes. A tool call made from a script doesn’t show up in the conversation as its own step: the transcript only contains the script. That’s fine for reads, but for a change to someone’s systems we want every operation to be its own visible step, with its exact input. So
executeCoderefuses state-changing calls when a person is in the conversation, and the model makes them one at a time as normal tool calls. - Timeouts. A script has a single timeout, and every call inside it draws on it. A slow telemetry query can starve the calls after it, so we give each kind of tool its own slice of the budget, and tell the model to run independent calls in parallel.
- Binary data. Whatever a script returns comes back to the model as text, serialised as JSON. Images, screenshots and files don’t survive that well, so tools that return them are better called directly, where the harness can hand the image to the model as an image.
Code mode for any agent
If you’re building an agent with more than a handful of tools, you don’t need MCP to get the benefits of code mode:
- Put your tools behind one code tool. An index of the tools in the prompt, and their types on demand.
- Generate output types. The model writes code against a result before it has seen it, so it needs to know its shape.
- Run the code with no network. Pass the tools in, so credentials never enter the isolate.
- Teach the model to write defensive scripts. Catch errors per call, run calls in parallel, and return only what’s needed.
Code mode is a better way for agents to use tools.