

Cloudflare Durable Objects의 메모리 초과 오류를 고친 방법
Explore with AI
Polylane의 모든 에이전트 스레드는 자체 Cloudflare Durable Object 안에서 실행되며, 모두 하나의 클래스의 인스턴스입니다. 2026년 8월, 저희 스레드의 Durable Object는 메모리 한도 초과로 하루에 약 300번 리셋되었습니다. Cloudflare Durable Object에서 에이전트 플로를 운영하는 여러 팀에서 같은 이야기를 들었습니다.
Durable Object에서 exceededMemory를 만났다면, 일반적인 조언은 요청이 무엇을 할당하는지 보라는 것입니다. 너무 큰 페이로드, 끝없이 커지는 채팅 기록, 절대 비워지지 않는 캐시. 저희에게는 그중 어느 것도 해당하지 않았습니다. isolate는 단 하나의 요청을 처리하기 전에 이미 한도를 넘어 있었으므로, 무게는 저희가 서비스하는 데이터가 아니라 출시한 코드에 있어야 했습니다.
이 글은 힙에 실제로 무엇이 있었는지, 프로파일러를 붙일 수 없는 플랫폼에서 그것을 어떻게 찾았는지, 그리고 모듈 스코프 메모리를 218 MB에서 82 MB로, 리셋을 0으로 줄인 두 가지 변경에 관한 것입니다.
1분 만에 보는 Cloudflare Durable Objects
써 본 적이 없다면: Durable Object는 Cloudflare가 주어진 ID에 대해 유일함을 보장하는 작고, 상태를 가진, 단일 스레드 서버입니다. Worker에서 그 ID로 idFromName()을 호출하면 세계 어디에서 오든 그 ID에 대한 모든 요청이 같은 인스턴스에 도착하며, 인스턴스는 자체 SQLite 데이터베이스, 인메모리 상태, 알람을 갖습니다. 유휴 상태에서는 하이버네이션에 들어가고, 멈춘 곳에서 다시 깨어납니다.
Polylane에서는 스레드마다 Durable Object 인스턴스를 만듭니다. 사람이 시작했든 경보가 시작했든, 에이전트와의 모든 대화는 자체 Durable Object를 갖습니다. 객체의 SQLite가 스레드의 메시지와 도구 결과를 보관하고, 에이전트 루프가 그 안에서 실행되며, 도구는 스레드에 필요한 제공자를 호출합니다. Datadog, Sentry, Honeycomb, GitHub, Cloudflare 등. 스레드가 조용해지면 객체는 하이버네이션에 들어가고, 다음 메시지가 도착하면 정확히 멈춘 곳에서 이어 갑니다.
![graph TB
U["New message or alert"] --> W["Worker"]
W -->|"idFromName(threadId)"| DO["One Durable Object per thread"]
DO --> S["SQLite: messages, tool results"]
DO --> L["Agent loop"]
L --> T["Tools"]
T --> P1["Datadog"]
T --> P2["Sentry"]
T --> P3["Honeycomb"]
T --> P4["GitHub, Cloudflare, ..."]
style DO fill:#d1fae5,stroke:#6ee7b7,color:#065f46](/diagrams/efa7281c.svg)
Durable Objects 메모리의 동작 방식
- Isolate와 128 MB 상한. Durable Objects는 V8 isolate 안에서 실행되며, isolate에는 모든 플랜에서 동일하고 설정할 수 없는 128 MB의 하드 메모리 리밋이 있습니다.
- 코로케이션. 하나의 isolate가 같은 클래스의 많은 Durable Object를 호스팅하고, 그 주변의 Worker 코드도 함께 있으며, 모두 그 isolate의 메모리를 공유합니다. 한도는 객체별이 아니라 isolate별입니다.
- 시끄러운 이웃. 코로케이션 때문에, isolate가 메모리를 소진했을 때 리셋되는 객체는 종종 메모리를 사용한 객체가 아닙니다. Cloudflare가 보고하는 모든 메모리 샘플은 isolate 전체의 것이고, 모든 리셋도 그렇습니다.
![graph TB
subgraph ISO["One V8 isolate, 128 MB cap"]
M["Module scope, loaded once"]
D1["Instance A"]
D2["Instance B"]
D3["Instance C"]
end
M --- D1
M --- D2
M --- D3
D3 -->|"heap crosses 128 MB"| R["exceededMemory, C is reset"]
style M fill:#fee2e2,stroke:#fca5a5,color:#7f1d1d
style R fill:#fee2e2,stroke:#fca5a5,color:#7f1d1d](/diagrams/79348818.svg)
프로덕션 Durable Object에 메모리 프로파일러를 붙일 방법은 없습니다. Cloudflare가 문서화한 힙 스냅숏 도구는 로컬 개발 세션에서 실행됩니다. Kubernetes라면 프로파일링을 켜고 문제를 찾을 때까지 붙여 두면 됩니다. workerd에서 process.memoryUsage()는 0을 반환하는 unenv 폴리필이고, 기준 메모리와 CPU 수치는 안에서 실행되는 코드에 보이지 않습니다. 얻을 수 있는 것은 Cloudflare의 GraphQL 분석 API입니다. 네임스페이스별 메모리 백분위수와 크래시 수, 사후에.
메모리 그래프가 말해 준 것
Cloudflare의 분석 API는 Durable Object 네임스페이스의 메모리를 그것을 실행하는 isolate 전반의 백분위수로, 15분 버킷 단위로, 각 버킷의 메모리 초과 오류 수와 함께 보고합니다. 이 글의 모든 그래프는 그 API에서 나왔으며, 스레드 네임스페이스로 필터링하고 수정을 출시하기 시작한 뒤에는 배포 마커를 기준으로 비교했습니다.
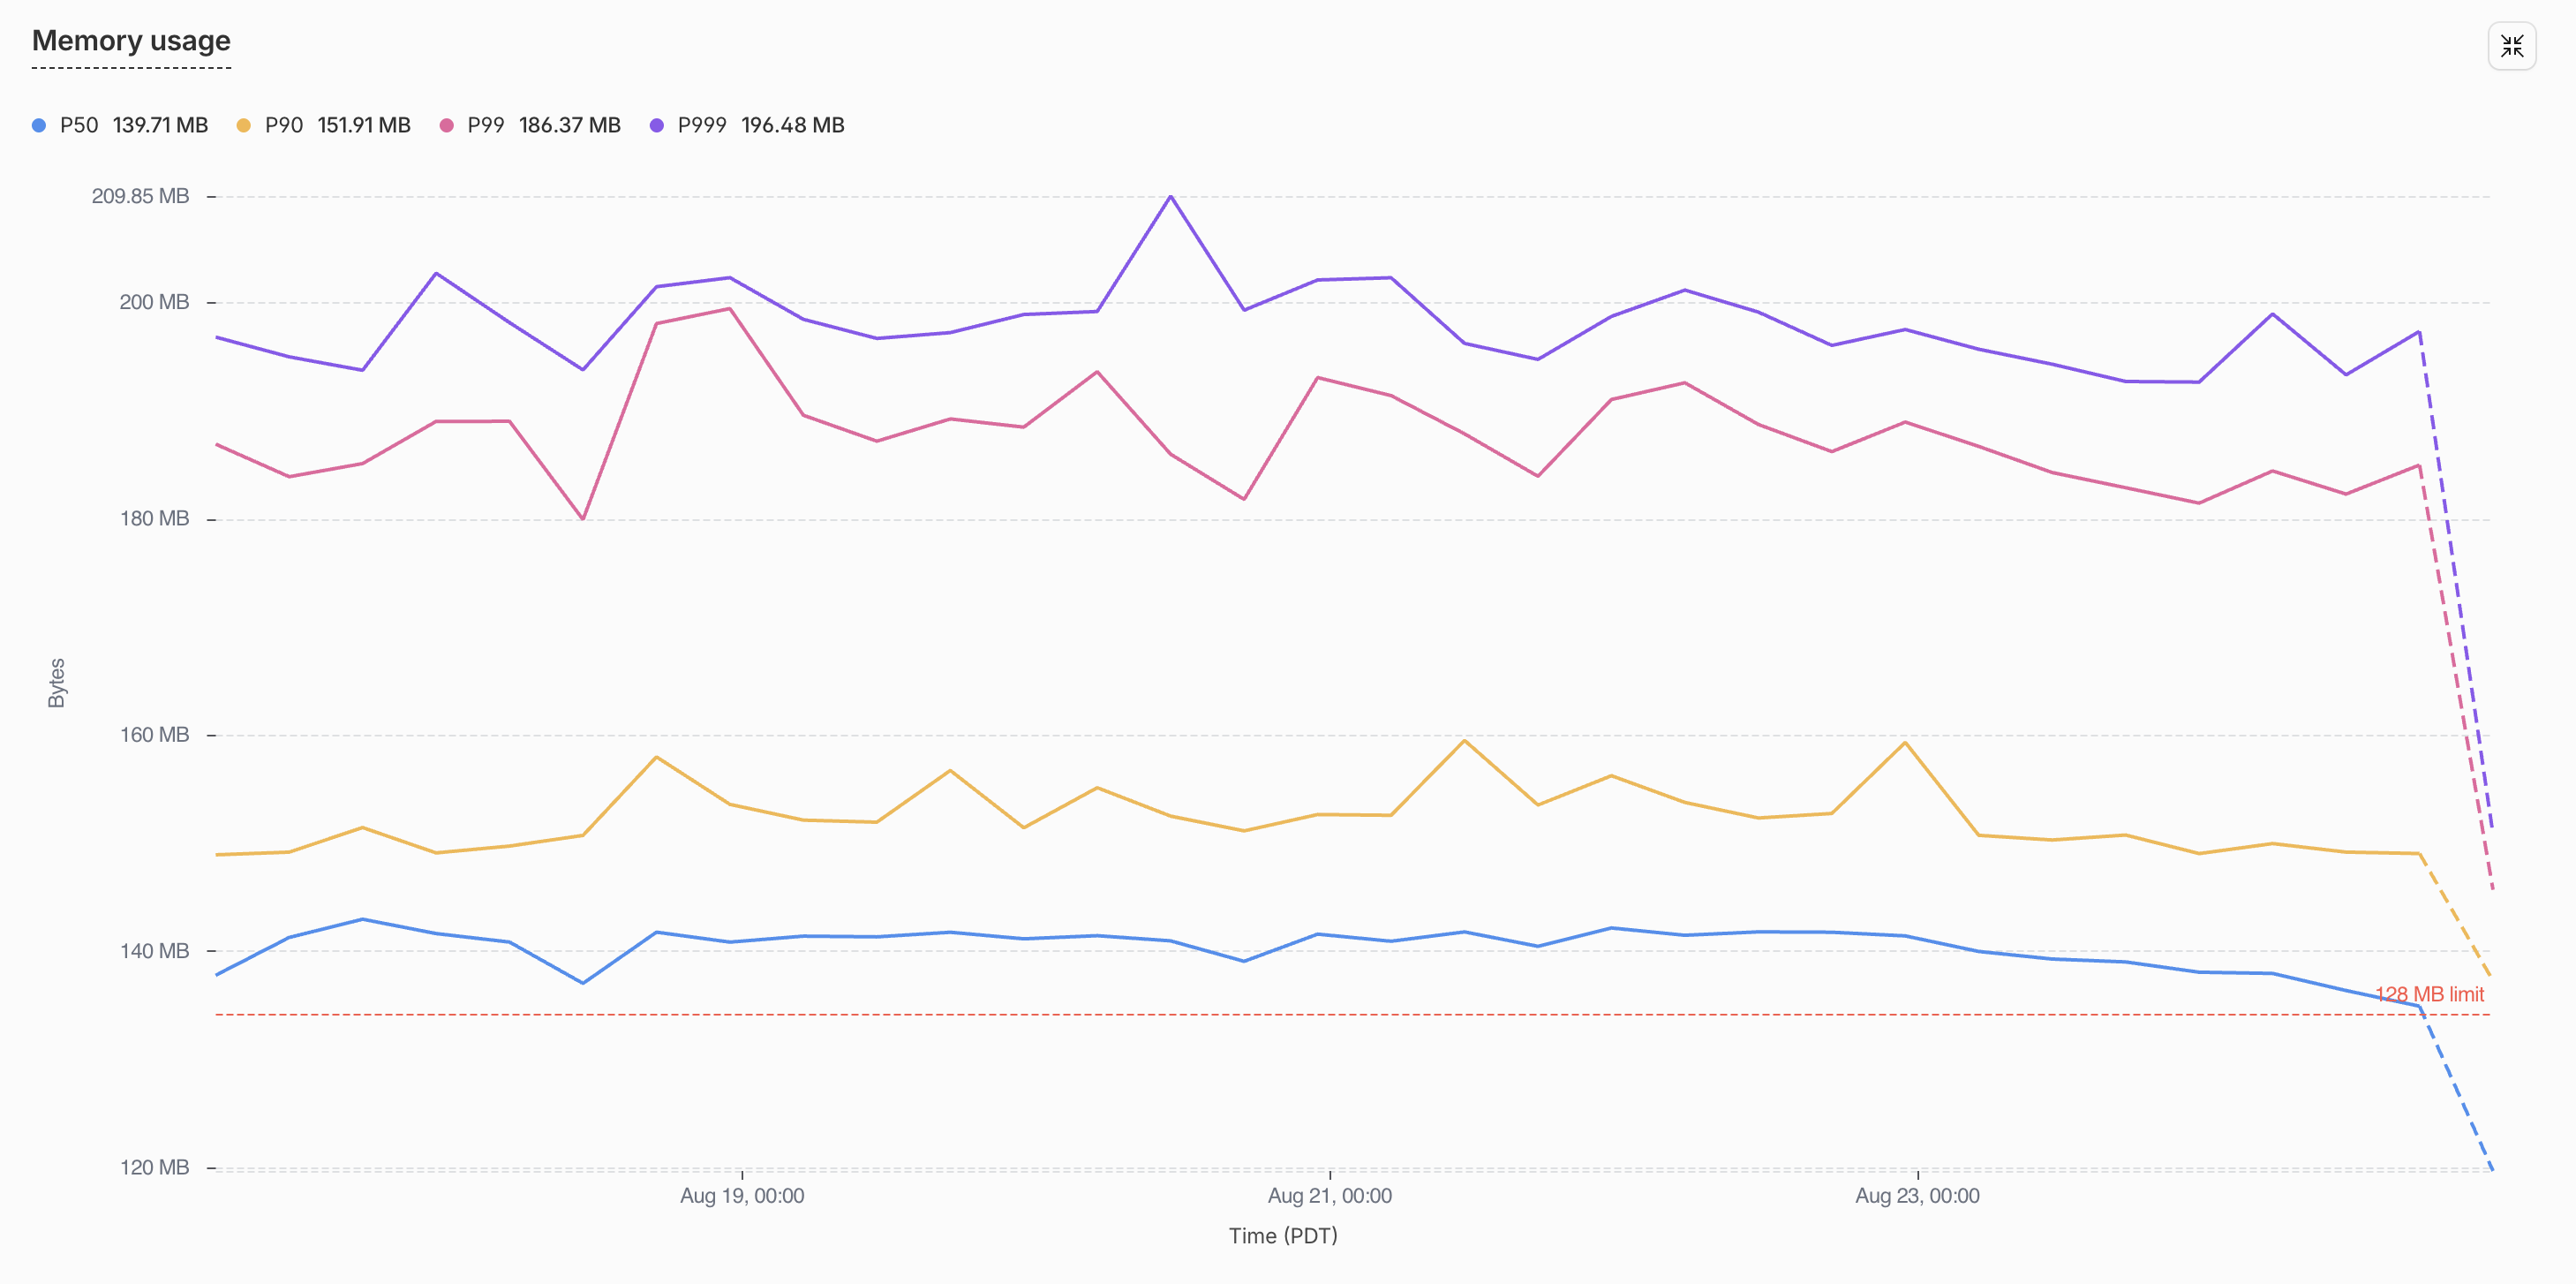
그림 1의 파란 선인 중앙값 isolate는 한 주 내내 약 140 MB에 있었고, 99번째 백분위수는 190 MB 근처에 있었습니다. 두 선 모두 점선으로 표시된 128 MB 한도 위에 있는데, 이는 네임스페이스의 전형적인 isolate가 Cloudflare가 리셋할 권리를 갖는 지점을 이미 지났고, 다음 할당이 넘어뜨릴 때까지만 살려 두어졌음을 뜻합니다. 그래프가 보여 주지 않은 것은 트래픽과의 어떤 관계였습니다. 선은 조용한 시간에도 바쁜 시간과 똑같이 평평했고, 하루 약 300번의 리셋 중 어느 것도 스택 트레이스와 함께 오지 않았습니다. 예외를 던진 것이 저희 코드였던 적이 없었으니까요.
먼저 볼 것으로 예상되는 곳을 봤습니다. 페이로드 크기를 읽고, 채팅 기록이 어떻게 잘리는지 확인하고, 메모리 곡선에서 요청 패턴을 찾았지만, 선을 움직이는 것은 아무것도 없었습니다. 그 평평함이 중요한 단서였습니다. isolate의 메모리는 두 가지 중 하나입니다. 데이터, 즉 요청 페이로드, 채팅 기록, 도구 출력, 그 밖에 트래픽을 처리하는 동안 할당되는 모든 것이거나, 기준선, 즉 모듈이 로드될 때 코드 자체가 만들어 isolate의 수명 동안 살려 두는 객체들, 예컨대 import, 함수, 스키마입니다. 데이터는 요청에 따라 오르고 내리지만, 기준선은 첫 요청 전부터 있고 절대 사라지지 않으므로, 유휴 상태에서 높고 평평한 그래프는 기준선을 묘사하는 것입니다. 문제는 저희가 서비스하는 것이 아니라 출시하는 것에 있어야 했습니다.
![graph TB
H["Isolate heap"] --> B["Baseline: built at module load"]
H --> D["Data: allocated per request"]
B --> B1["imports"]
B --> B2["tool schemas"]
B --> B3["package barrels"]
D --> D1["payloads"]
D --> D2["chat history"]
D --> D3["tool outputs"]
style B fill:#fee2e2,stroke:#fca5a5,color:#7f1d1d](/diagrams/bf60aa6a.svg)
기준선 메모리를 놓치기 쉬운 이유
기준선 메모리는 평소에 보지 않는 두 곳에 숨어 있습니다.
첫째는 번들러입니다. 우리는 트리 셰이킹이 쓰지 않는 코드를 제거한다고 가정하고, 대체로 그렇지만, esbuild에는 언제 가지치기할 수 있는지에 대한 규칙이 있고 그 규칙은 짐작하는 것과 다릅니다. package.json에 "sideEffects": false가 없는 패키지는 전혀 가지치기되지 않습니다. 지연 평가되는 모듈 안의 export *도 절대 가지치기되지 않습니다. 패키지 루트의 동적 import()는 모든 export를 사용됨으로 표시합니다. 이 각각은 수정 부분에서 다시 다루겠습니다. 130 MB의 절반을 설명하기 때문입니다.
// Three ways to keep every zod schema in a package alive in the isolate,
// none of which look like a mistake.

// The package has no "sideEffects": false, so nothing in it is pruned.
import { getWorkspaceStub } from "@scope/durable-workspaces";

// Inside a lazily evaluated module, export * is never pruned.
export * from "./zod";

// A namespace object marks every export as used, schemas included.
const pkg = await import("@scope/durable-workspaces");
둘째는 스키마 라이브러리입니다. 타입은 컴파일 시점에 사라지므로 공짜처럼 느껴지지만, zod 스키마는 타입이 아니라 모듈이 평가되는 순간 만들어지는 클로저 트리입니다. 설명과 정제가 붙은 열두 개 필드의 중간 크기 zod 4 객체 스키마 하나는 ~134 KB의 힙을 차지합니다. 맨 z.string()은 ~12 KB입니다. 동등한 일반 JSON 스키마 객체는 몇백 바이트입니다. 그중 어느 것도 README에 없습니다.
// What each of these costs the moment its module evaluates.
const Params = z.object({                     // ~134 KB for a dozen fields like these
  owner: z.string().describe("Repository owner"),
  repo: z.string().describe("Repository name"),
  pullNumber: z.number().int().describe("PR number"),
});
const Name = z.string();                      // ~12 KB

const params = {                              // a few hundred bytes
  type: "object",
  properties: { owner: { type: "string" }, repo: { type: "string" } },
} as const;
저희는 특별한 일을 하지 않았습니다
저희 문제 하나하나는 기본값에서 왔습니다. 모든 에이전트 도구가 모듈 스코프에서 z.object()로 입력을 선언했습니다. 문서가 그렇게 하기 때문입니다. 모든 내부 패키지에 export * from "./zod"가 있는 배럴 index.ts가 있었습니다. 깔끔하기 때문입니다. 몇몇 경로는 await import("@scope/package")를 썼습니다. 지연 로딩이 더 저렴하다고들 하기 때문입니다. 각각은 그 자체로 합리적인 선택입니다. 합쳐지면 130 MB였고, isolate에는 쓸 수 있는 것이 128이었습니다.
// packages/tools/src/github/get-pull-request.ts, and 250 more like it
export const parameters = z.object({
  owner: z.string().describe("Repository owner"),
  repo: z.string().describe("Repository name"),
  pullNumber: z.number().int().describe("PR number"),
});

// packages/thread-core/src/index.ts, and every other internal package
export * from "./zod";
export * from "./thread";

// packages/durable-threads/src/agent.ts
const { getWorkspaceStub } = await import("@scope/durable-workspaces");
그것이 저희에게 든 비용
저희 에이전트에는 250개가 넘는 도구가 있고, 코드 모드와 동적 워커를 통해 사용합니다. 그 zod 정의만으로 모듈 로드 시 78 MB의 힙이 들었습니다. isolate 예산의 절반 이상이, 어느 것이 호출되기도 전에 인자 설명에 쓰인 것입니다. 도구를 추가할 때마다 그 도구가 실행되든 아니든 ~134 KB가 더 들었습니다.
250+ tools × ~134 KB of zod each   ≈  78 MB   evaluated before the first request
128 MB isolate cap − 78 MB         =  50 MB   left for every thread's actual data
리셋도 공짜가 아니었습니다. 모든 exceededMemory는 진행 중인 에이전트 턴을 버립니다. 재시도, 두 번째 모델 호출, 스피너를 바라보는 사용자. 하루 ~300번이면 인시던트가 아니라 상시적인 세금이 되고, 코로케이션 때문에 그 순간 isolate에 있던 어떤 객체든 그 비용을 냈습니다.
Error: Durable Object's isolate exceeded its memory limit and was reset.찾아낸 방법: 프로덕션 번들용 힙 프로파일러
프로덕션을 프로파일링할 수 없었으므로, 프로덕션이 실행하는 정확한 번들에서 로컬로 실행되는 작은 프로파일러를 만들었습니다. 모든 모듈을 평가하는 V8 힙 비용을 측정해 순위표를 출력합니다. 루프로 돌렸습니다. 프로파일링하고, 순위 맨 위를 제거하고, 다시 프로파일링합니다. 모든 수정의 최종 확인은 배포 마커 양쪽의 Cloudflare 메모리 메트릭을 비교한 프로덕션 배포였습니다.
![graph TB
A["wrangler deploy --dry-run"] --> B["production bundle + metafile"]
B --> C["instrument the __esm helper"]
C --> D["run under Node with stubs"]
D --> E["exclusive heap per module"]
style E fill:#d1fae5,stroke:#6ee7b7,color:#065f46](/diagrams/0b647474.svg)
세 가지 아이디어가 이를 가능하게 합니다.
- 같은 번들.
wrangler deploy --dry-run --outdir --metafile은 배포가 업로드할 정확한 esbuild 번들과 그 모듈 그래프를 내보냅니다. 모든 측정은 그 번들에서 합니다. - 모듈 귀속. esbuild는 지연 평가되는 모듈을
__esm(...)초기화 클로저로 감쌉니다. 빌드된 번들에서 그 헬퍼 하나를 다시 써서, 모든 모듈 초기화가 자기 전후로v8.getHeapStatistics().used_heap_size를 기록하게 하고, 초기화 스택으로 모듈 자체의 비용(exclusive)과 의존성의 비용(inclusive)을 분리합니다. 결과는 플레임그래프 모양의 데이터셋입니다. - 통제된 실행. 계측된 번들은
cloudflare:*import를 스텁으로 해석하는 로더 심과 함께 일반 Node에서 실행됩니다.
코딩 에이전트에 붙여 넣을 수 있는 전체 레시피는 이 글 끝에 있습니다. 위에 인용한 zod 단위 비용은 같은 하네스로 실행한 마이크로 벤치마크에서 나왔습니다.
첫 프로파일이 보여 준 것
| 소스 | Exclusive 힙 |
|---|---|
packages/tools (250개 이상의 에이전트 도구 정의, zod) | 78.0 MB |
| zod 스키마 모듈을 재export하는 패키지 배럴 (아래 행들) | ~66 MB |
durable-workspaces (워크스페이스 상태와 스케줄) | 15.6 MB |
thread-core (스레드 데이터 계층) | 10.1 MB |
durable-automations (자동화 정의) | 9.6 MB |
durable-threads (스레드 목록과 실시간 업데이트) | 7.3 MB |
durable-automation (자동화 실행 하나) | 6.8 MB |
db (D1 클라이언트와 모델) | 6.3 MB |
durable-skills (스킬 정의) | 5.7 MB |
durable-autofixes (자동 수정 브랜치와 병합) | 4.9 MB |
| 더 작은 패키지 12개 | ~9 MB |
두 번째 행이 놀라운 부분입니다. 패키지 배럴의 export * from "./zod"를 통해서만 번들에 도달하는 스키마들입니다. 저희 코드는 한 번도 쓰지 않았고, 트리 셰이커는 제거할 수 없었고, 메모리 한도의 3분의 1을 차지했으며, 전부 아무것도 호출하지 않는 모듈에 있었습니다.
수정 A: 도구 정의를 코드가 아니라 데이터로
모든 도구 정의가 입력 스키마를 zod로 선언하고 런타임에 JSON 스키마로 변환했습니다. 어차피 모델에 보내는 것은 JSON 스키마이기 때문입니다. 몇백 바이트의 데이터를 만들기 위해 도구당 ~134 KB의 클로저를 만들고 있었으므로, 데이터를 직접 썼습니다.
![graph TB
Z["zod schema, ~134 KB per tool"] --> J["toJSONSchema() at runtime"]
J --> M["JSON schema sent to the model"]
D["JSON schema, ~0.3 KB per tool"] --> M
style Z fill:#fee2e2,stroke:#fca5a5,color:#7f1d1d
style D fill:#d1fae5,stroke:#6ee7b7,color:#065f46](/diagrams/5f84b543.svg)
// before: ~134 KB of closures per tool, built at module load
export const parameters = z.object({
  owner: z.string().describe("Repository owner"),
  repo: z.string().describe("Repository name"),
  pullNumber: z.number().int().describe("PR number"),
});

// after: a few hundred bytes of data, and the type comes from the schema
export const parameters = defineParameters({
  type: "object",
  properties: {
    owner: { type: "string", description: "Repository owner" },
    repo: { type: "string", description: "Repository name" },
    pullNumber: { type: "number", description: "PR number" },
  },
  required: ["owner", "repo", "pullNumber"],
} as const);
export type Input = ParametersInput<typeof parameters>;defineParameters는 AI SDK의 jsonSchema()를 얇게 감싼 것입니다. ParametersInput은 zod가 하던 타입 추론을 json-schema-to-ts가 하는 것입니다. 런타임 검증은 에이전트 루프가 의존하는 속성을 재현하는 ~300줄의 검증기로 옮겨 갔습니다. 알 수 없는 키 제거, 기본값 채우기, 판별자로 유니언 해석, 그리고 모델이 재시도 시 자기 도구 호출을 스스로 고칠 수 있도록 표현된 오류 메시지.
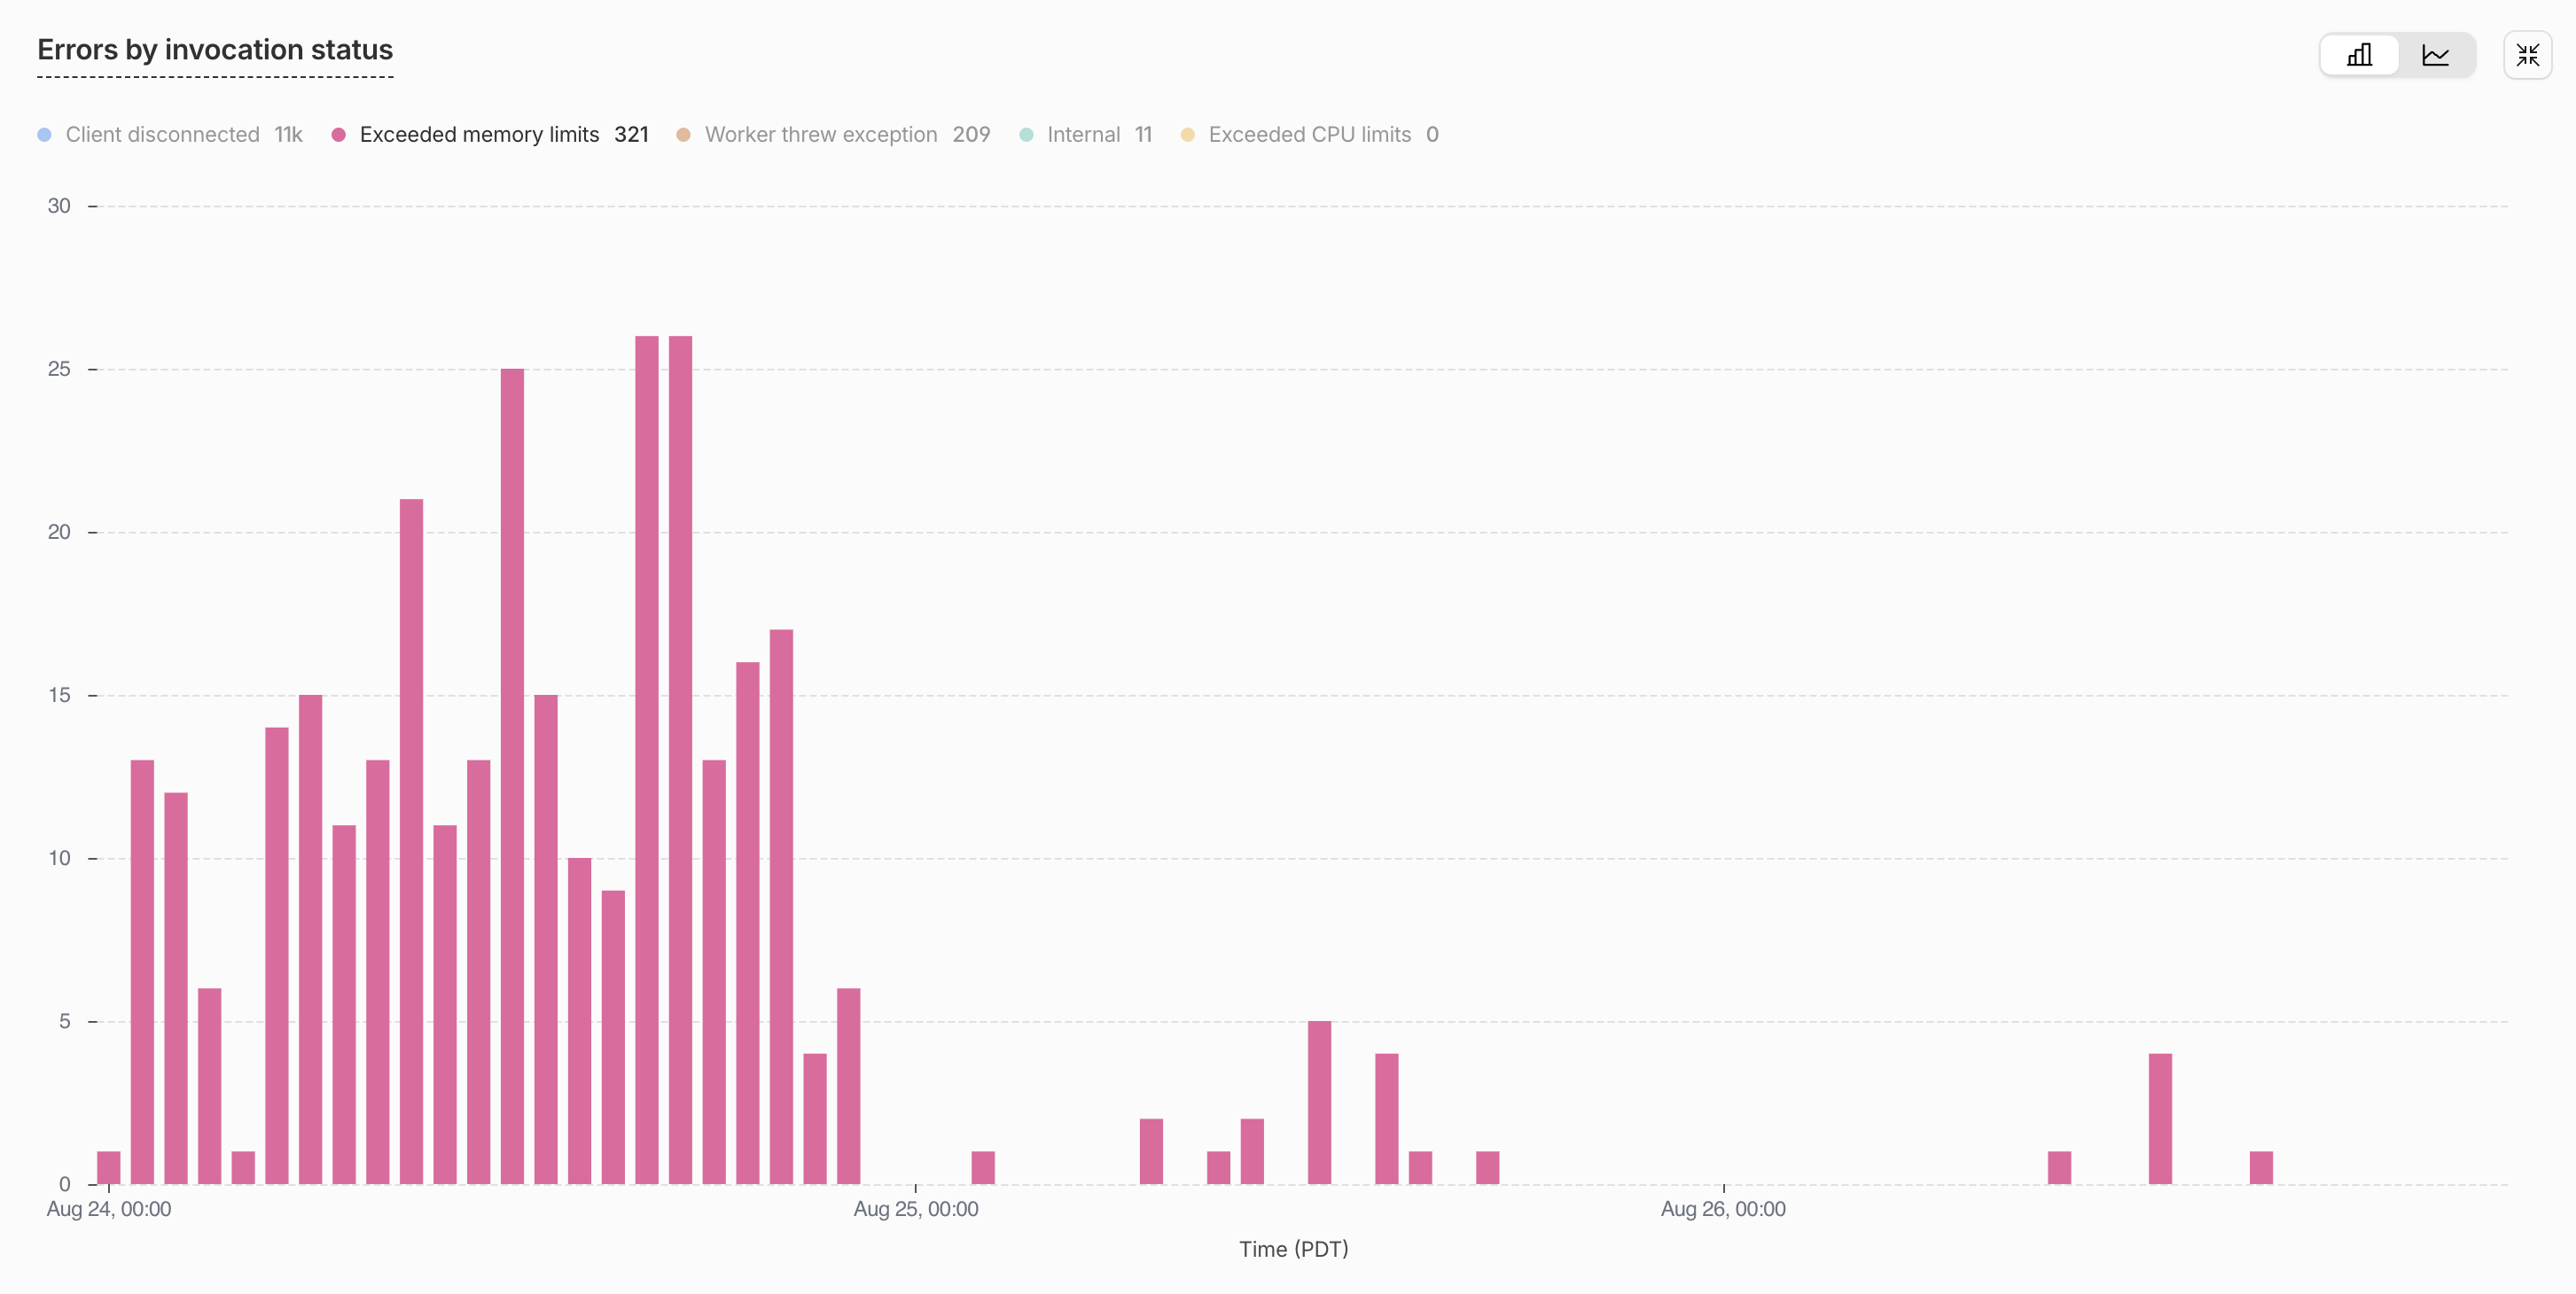
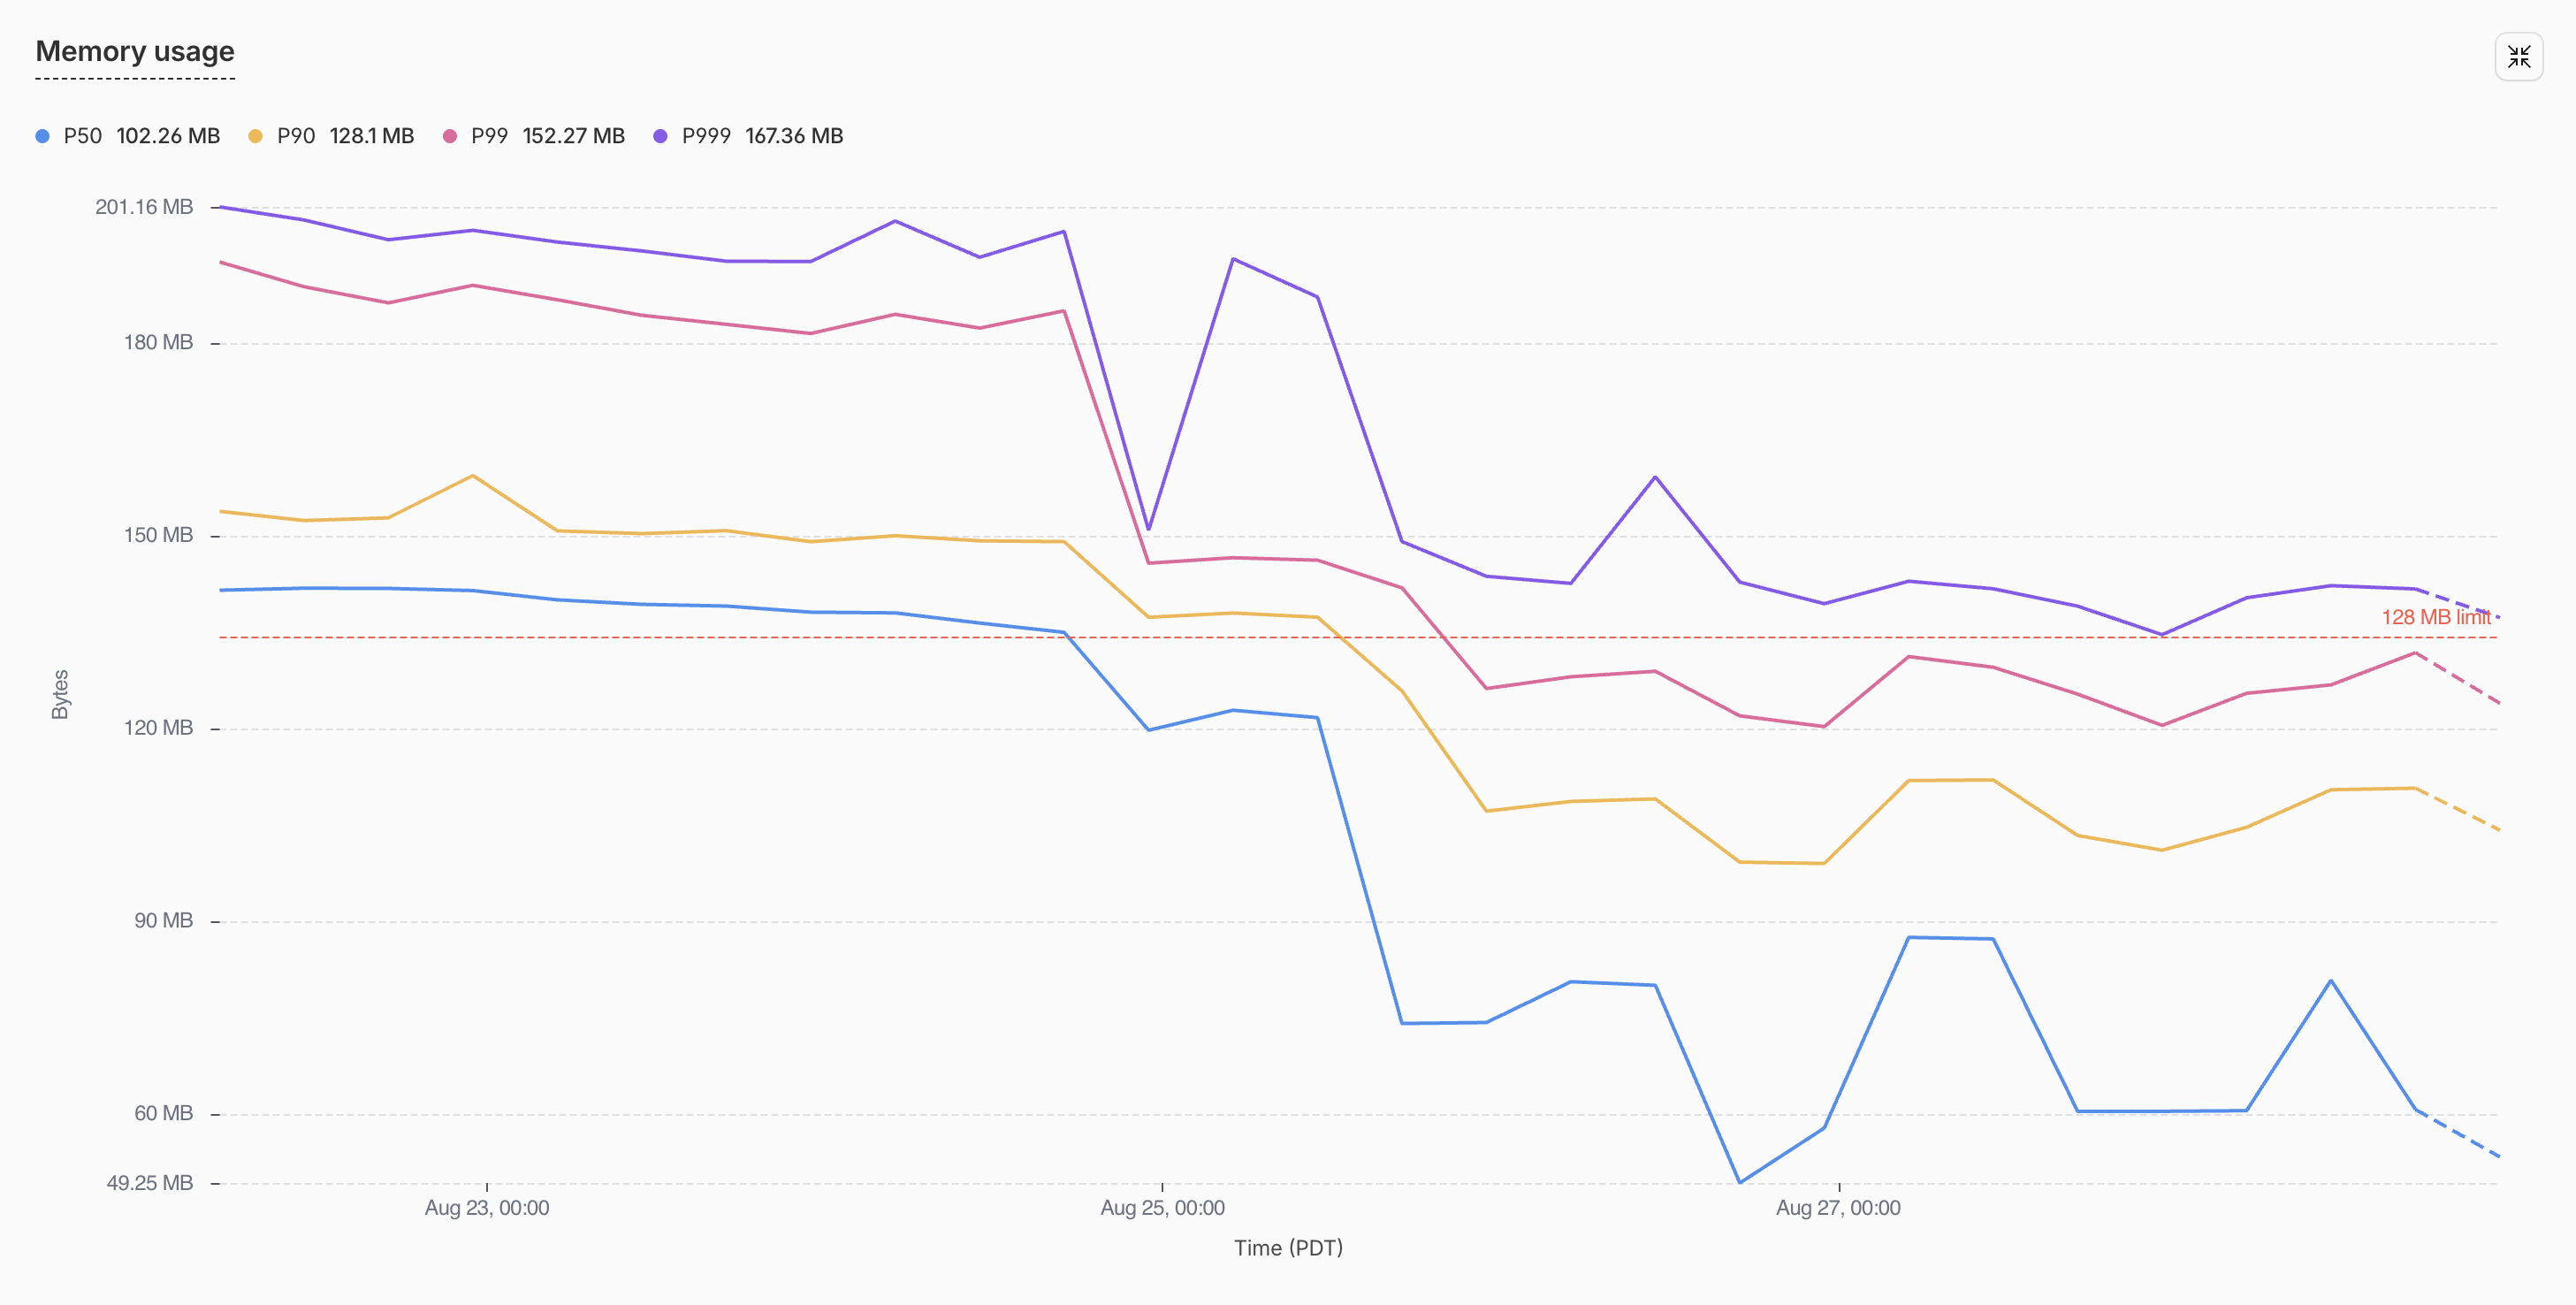
모듈 평가 힙이 로컬에서 218.6 MB에서 154.0 MB로, packages/tools가 78 MB에서 0.7 MB로 줄었습니다. 프로덕션에서는 배포 마커에서 리셋이 시간당 40-110회에서 0-6회로, 중앙값 isolate의 메모리가 ~140 MB에서 ~120 MB로 떨어졌습니다.
수정 B: 실제로 트리 셰이킹되는 배럴
남은 ~66 MB는 isolate가 한 번도 쓰지 않은 스키마였습니다. 세 가지 번들러 동작이 이를 설명합니다.
- 패키지의
package.json에"sideEffects": false가 없으면 esbuild는 그 패키지에서 아무것도 가지치기하지 않습니다. - 플래그가 있어도
export * from "./zod"는 지연 평가되는 모듈 안에서는 절대 가지치기되지 않고, 동적import()를 통해 도달할 수 있는 모든 것은 지연 평가됩니다. 이름 있는 재export(export { zFoo } from "./zod")는 잘 가지치기됩니다. await import("@scope/package")는 패키지의 전체 네임스페이스 객체를 구체화하여 모든 export를 사용됨으로 표시합니다. 스키마, 클래스, 전부.
wrangler가 내장한 esbuild 버전으로 만든 다섯 파일짜리 픽스처로 각각을 확인했습니다. 엔트리, index.ts 배럴이 있는 패키지, 생성자가 실행될 때 알리는 스키마 하나를 담은 zod.ts, 그 스키마를 import하는 do.ts 클래스, 그리고 그 사이의 지연 중간 모듈. 표는 각 조합에서 스키마의 생성자가 평가 시 실행되었는지를 기록합니다.
| 엔트리가 배럴을 import하는 방식 | 배럴 재export 형태 | sideEffects: false | 스키마 포함 |
|---|---|---|---|
| 정적 import | export * | 예 | 아니요 |
| 정적 import | export * | 아니요 | 예 |
패키지의 동적 import() | 무엇이든 | 예 | 예 |
| 지연 로드되는 모듈에서의 정적 import | export * | 예 | 예 |
| 지연 로드되는 모듈에서의 정적 import | 이름 목록 | 예 | 아니요 |
| 무엇이든 | 이름 목록 | 아니요 | 예 |
3행과 4행이 사람들을 놀라게 하는 둘이며, 합쳐서 ~66 MB를 차지했습니다. 배럴 하나가 저희에게 하고 있던 일은 이렇습니다.
![graph TB
A["do.ts imports one function"] --> B["durable-workspaces barrel"]
B -->|"export * from './zod'"| C["zod/*.ts, 15.6 MB of schemas"]
B -->|"used"| D["getWorkspaceStub(), ~1 KB"]
style C fill:#fee2e2,stroke:#fca5a5,color:#7f1d1d
style D fill:#d1fae5,stroke:#6ee7b7,color:#065f46](/diagrams/5d71e80c.svg)
수정은 기계적입니다. 110개가 넘는 모든 워크스페이스 패키지에 "sideEffects": false를 넣고, 배럴의 export *를 이름 있는 재export 목록으로 다시 쓰고, 패키지 루트의 await import("@scope/package")를 정적 이름 import로 바꿉니다.
실제 프로덕션 번들에 대한 절제 실험은 각 조각이 필요함을 보여 줍니다.
| 구성 | 모듈 평가 후 힙 | 번들 내 스키마 모듈 |
|---|---|---|
| 기준선 (수정 A 이후) | 154.0 MB | 77 |
sideEffects: false만 | 143.6 MB | 77 |
+ 정적 import, 배럴은 export *로 되돌림 (대조군) | 98.6 MB | 29 |
| + 이름 있는 재export 목록 (전체 수정) | 82.1 MB | 0 |
대조군 행이 흥미로운 부분입니다. 완전히 정적인 import 그래프조차 29개의 스키마 모듈을 남기므로, 이름 목록은 선택이 아닙니다.
최종 상태
| 모듈 스코프 힙 (로컬 프로브) | 프로덕션 중앙값 메모리 | 프로덕션 리셋 | |
|---|---|---|---|
| 전 | 218.6 MB | ~140 MB | ~300/일 |
| A 이후 | 154.0 MB | ~120 MB | ~10/일 |
| A+B 이후 | 82.1 MB | ~70 MB | 0 |
플랫폼의 메모리 한도 위에서 유휴 상태였던 Durable Object가 이제 그 절반 남짓에서 유휴 상태이고, 하루 ~300번의 리셋은 사라졌습니다.
이것은 설정 플래그가 아닙니다
250개가 넘는 도구 정의를 zod에서 원시 JSON 스키마로 다시 쓰고, zod가 해 주던 일을 대신하는 300줄의 검증기를 쓰는 데 코딩 에이전트가 있어도 며칠이 걸렸습니다. 100개가 넘는 패키지에 sideEffects: false를 넣고 모든 export *를 생성된 이름 목록으로 바꾸는 것은 화려하지 않은 일이고, 그 뒤에 리포지토리 전체를 타입체크하고 깨진 것을 고칩니다. 쉬운 대안은 재시도를 추가하고 리셋과 함께 사는 것이고, 많은 팀이 그렇게 합니다. Durable Object가 유휴 상태에서 한도 근처에 있다면 그 한 주는 그만한 가치가 있다고 봅니다. 한도는 움직이지 않고 도구 수는 늘어나기만 하기 때문입니다.
첫날부터 알았다면 좋았을 세 가지:
- 유휴 상태에서 높고 평평하면 기준선입니다. 서비스하는 것이 아니라 출시하는 것을 프로파일링하세요.
- 트리 셰이킹에는 규칙이 있습니다.
sideEffects: false, 이름 있는 재export, 정적 import. 하나만 놓쳐도 패키지 전체가 따라옵니다. - 스키마는 타입이 아니라 코드입니다. 소비자가 JSON 스키마를 원한다면 JSON 스키마를 쓰세요.
오늘 바로 Durable Object의 메모리를 고치는 방법
프로파일러는 Node와 wrangler 외에 의존성이 없는 ~100줄입니다. 아래 레시피를 wrangler로 배포하는 어떤 리포지토리의 루트에서든 코딩 에이전트에 붙여 넣고, 출력되는 표의 상위 열 행을 읽고, 무엇이 있는지 보세요. 그다음 목록을 따라 내려가세요. 모델이 어차피 JSON 스키마로 받는 것은 일반 JSON 스키마로, 배럴에는 "sideEffects": false와 이름 있는 재export로, 패키지 루트에는 정적 import로.
Build a per-module heap profiler for my worker's production bundle.

1. Emit the exact production bundle and metafile:

   cd <worker-dir>
   npx wrangler deploy --dry-run --env <stage> --config wrangler.jsonc \
     --outdir /tmp/heap-probe --metafile /tmp/heap-probe/meta.json

   If the worker's import graph is fully static, esbuild emits no lazy
   `__esm` wrappers and per-module attribution is impossible. In that case
   build from a probe-only entry that reaches the real entry through a
   dynamic import (and satisfies wrangler's Durable Object export check
   with a placeholder class):

   // probe-entry.ts
   export default { fetch: () => new Response("probe") };
   export class <YourDurableObjectClassName> {}
   export const probeLoad = () => import("<path-to-real-entry>");

   npx wrangler deploy --dry-run --env <stage> --config wrangler.jsonc \
     --outdir /tmp/heap-probe --metafile /tmp/heap-probe/meta.json probe-entry.ts

2. Instrument the bundle. Write instrument.mjs and run
   `node instrument.mjs /tmp/heap-probe`:

   import { readFileSync, writeFileSync } from "node:fs";
   import { join } from "node:path";

   const outDir = process.argv[2];
   const bundlePath = join(outDir, "probe-entry.js"); // or index.js
   const source = readFileSync(bundlePath, "utf-8");

   const esmHelperPattern = /var __esm = \(fn, res(?:, \w+)?\) => function __init\(\) \{[\s\S]*?\n\};\n/;
   if (!esmHelperPattern.test(source)) throw new Error("__esm helper not found; esbuild output shape changed");

   const instrumentedHelper = `var __probeInitStack = [];
   var __esm = (fn, res, err2) => function __init() {
     if (err2) throw err2[0];
     if (!fn) return res;
     const probe = globalThis.__moduleHeapProbe;
     if (!probe) {
       try { return (res = (0, fn[__getOwnPropNames(fn)[0]])(fn = 0)), res; }
       catch (e) { throw ((err2 = [e]), e); }
     }
     const moduleName = __getOwnPropNames(fn)[0];
     const frame = { child: 0 };
     const before = probe.heap();
     __probeInitStack.push(frame);
     try { return (res = (0, fn[moduleName])(fn = 0)), res; }
     catch (e) { throw ((err2 = [e]), e); }
     finally {
       const total = probe.heap() - before;
       __probeInitStack.pop();
       if (__probeInitStack.length > 0) __probeInitStack[__probeInitStack.length - 1].child += total;
       probe.record(moduleName, total - frame.child, total);
     }
   };
   `;
   writeFileSync(join(outDir, "instrumented.mjs"), source.replace(esmHelperPattern, instrumentedHelper));

3. Write a Node loader shim so worker-targeted code loads under Node.
   register.mjs resolves `cloudflare:*` to a stub module (an empty module
   exporting throwing placeholders for DurableObject, WorkerEntrypoint,
   env, etc.) via module.registerHooks; add a `load` hook for any
   non-JS rules in your wrangler config (for us: `.sql` files become
   text default exports, mirroring wrangler's Text rule).

4. Write probe.mjs and run it:

   node --expose-gc --import ./register.mjs probe.mjs /tmp/heap-probe

   import { join } from "node:path";
   import { pathToFileURL } from "node:url";
   import v8 from "node:v8";

   const outDir = process.argv[2];
   const records = [];
   globalThis.__moduleHeapProbe = {
     heap: () => v8.getHeapStatistics().used_heap_size,
     record: (moduleName, exclusive, total) => records.push({ moduleName, exclusive, total }),
   };
   const settle = async () => { await new Promise((r) => setTimeout(r, 0)); globalThis.gc(); globalThis.gc(); };
   const mb = (b) => (b / 1048576).toFixed(2);

   await settle();
   const bundle = await import(pathToFileURL(join(outDir, "instrumented.mjs")).href);
   if (bundle.probeLoad) await bundle.probeLoad();
   await settle();
   console.log(`heap after module evaluation: ${mb(v8.getHeapStatistics().used_heap_size)} MB`);

   for (const r of records.sort((a, b) => b.exclusive - a.exclusive).slice(0, 40))
     console.log(`${mb(r.exclusive).padStart(8)} MB  ${r.moduleName}`);

   const byPackage = new Map();
   for (const r of records) {
     const m = r.moduleName.match(/node_modules\/((?:@[^/]+\/)?[^/]+)|(packages\/[^/]+)/);
     const key = m ? (m[1] ? `npm:${m[1]}` : m[2]) : "other";
     byPackage.set(key, (byPackage.get(key) ?? 0) + r.exclusive);
   }
   for (const [k, v] of [...byPackage.entries()].sort((a, b) => b[1] - a[1]))
     if (v > 131072) console.log(`${mb(v).padStart(8)} MB  ${k}`);

5. Gotchas that will otherwise burn an afternoon:
   - The bundle's unenv polyfill replaces globalThis.process at init and its
     memoryUsage() reports zeros. Read v8.getHeapStatistics() instead.
   - Compare deltas between runs of this probe, never absolutes against
     production: Node's heap baseline differs from workerd's.
   - Modules evaluated eagerly at the top level (not wrapped in __esm) are
     invisible to attribution; the probe-entry trick in step 1 fixes that.
전체 감사를 대신 맡기고 싶다면, 코딩 에이전트를 위한 스킬이 여기 있습니다.
Audit this repo's worker bundles for module-scope schema weight, and fix what you find. Work in this order and show me numbers at every step.

1. Baseline. Using the "profile module-scope heap" recipe, build the
   production bundle of our most memory-sensitive worker and produce the
   per-module and per-package exclusive-heap ranking. Report heap after
   module evaluation.

2. Identify schema weight. From the ranking and the esbuild metafile, list
   every module matching your schema conventions (zod/valibot/etc. modules,
   e.g. packages/*/zod*) that survived into the bundle, with bytes. For each,
   compute one import chain from the entry using the metafile's `imports`
   graph (BFS), so we know *why* it is in the bundle.

3. Classify each surviving schema module:
   a. Actually used at runtime by this worker: leave it, or move the boundary.
   b. Reached through `export *` in a package barrel: candidate for named lists.
   c. Reached through `await import("<package root>")`: candidate for a static
      named import.
   d. Reached because the package lacks `"sideEffects": false`: candidate flag.

4. Apply, in this order, re-profiling after each:
   a. Add `"sideEffects": false` to every internal package that has no
      import-time side effects. Audit first: grep package sources for
      top-level globalThis mutations, addEventListener, polyfill assignment.
      Any true side-effect file gets `"sideEffects": ["./that-file.ts"]`.
   b. Rewrite `export * from "./<schemas>"` in package barrels to explicit
      `export { ... }` / `export type { ... }` lists. Generate the lists with
      the TypeScript compiler API (walk ExportDeclarations recursively,
      classify value vs type), never by regex. Typecheck the repo after.
   c. Replace every value-position `await import("@scope/pkg")` of a bare
      package root with a static named import of the symbols actually used.
      Check the site is not lazy for a *different* reason first (circular
      imports, Node-only test loading, genuine cold-path npm dependency).

5. If tool/LLM definitions build schema-library objects at module scope,
   propose converting them to plain JSON schema with types via
   json-schema-to-ts, and estimate the saving from step 1's ranking before
   doing it.

6. Verify: re-profile (report the delta), typecheck, run the affected
   packages' tests, and dry-run build every worker. Then add a CI assertion
   that reads the metafile of the memory-sensitive worker and fails if any
   schema module survives tree shaking into it, printing the import chain.

7. After deploy, compare the platform memory metrics across the deploy
   marker and report before/after median and 99th percentile memory, and reset
   counts.
저희는 이 스킬을 Polylane 자체에도 추가했으므로, 모든 Polylane 사용자는 붙여 넣을 것 없이 바로 Durable Object 메모리에 대한 이 깊은 조사를 받습니다.