

我們如何修復 Cloudflare Durable Objects 的記憶體超限錯誤
Explore with AI
Polylane 裡的每一個代理對話串都在自己的 Cloudflare Durable Object 內執行,全都是同一個類別的實例。2026 年 8 月,我們對話串的 Durable Objects 每天因為超過記憶體限制而被重置約 300 次。我們從多個在 Cloudflare Durable Objects 上執行代理流程的團隊那裡聽到了同樣的故事。
如果你在 Durable Object 上遇過 exceededMemory,常見的建議是去看你的請求配置了什麼:太大的 payload、無限增長的聊天歷史、從不淘汰的快取。這些都不適用於我們。isolate 在服務第一個請求之前就已經超過限制,所以重量一定在我們交付的程式碼裡,而不是我們服務的資料裡。
這篇文章講的是 heap 裡實際上有什麼、我們如何在一個不讓你附加剖析器的平台上找到它,以及把模組範圍記憶體從 218 MB 降到 82 MB、把重置降到零的兩個變更。
一分鐘認識 Cloudflare Durable Objects
如果你沒用過:Durable Object 是一個小型、有狀態、單執行緒的伺服器,Cloudflare 保證對於給定的 ID 它是唯一的。從 Worker 用那個 ID 呼叫 idFromName(),來自世界任何地方對它的每一個請求都會落在同一個實例上,它有自己的 SQLite 資料庫、記憶體內狀態與 alarm。閒置時它會休眠,醒來時從停下的地方繼續。
在 Polylane 中,我們為每個對話串建立一個 Durable Object 實例。與代理的每一段對話,無論是人開啟的還是警示開啟的,都有自己的 Durable Object。物件的 SQLite 保存對話串的訊息與工具結果,代理迴圈在其中執行,它的工具呼叫對話串所需的任何供應商:Datadog、Sentry、Honeycomb、GitHub、Cloudflare 等等。當對話串安靜下來,物件就休眠,下一則訊息到達時,它從停下的地方精確接續。
![graph TB
U["New message or alert"] --> W["Worker"]
W -->|"idFromName(threadId)"| DO["One Durable Object per thread"]
DO --> S["SQLite: messages, tool results"]
DO --> L["Agent loop"]
L --> T["Tools"]
T --> P1["Datadog"]
T --> P2["Sentry"]
T --> P3["Honeycomb"]
T --> P4["GitHub, Cloudflare, ..."]
style DO fill:#d1fae5,stroke:#6ee7b7,color:#065f46](/diagrams/efa7281c.svg)
Durable Objects 的記憶體如何運作
- isolate 與 128 MB 上限。 Durable Objects 在 V8 isolate 內執行,而一個 isolate 有 128 MB 的硬性記憶體限制,每個方案都一樣,且不可設定。
- 共置。 單一 isolate 承載同一類別的多個 Durable Objects,連同它們周圍的 Worker 程式碼,它們全部共用該 isolate 的記憶體。限制是以 isolate 為單位,而不是以物件為單位。
- 吵鬧的鄰居。 由於共置,當 isolate 記憶體耗盡時被重置的物件,往往不是用掉記憶體的那個物件。Cloudflare 回報的每一個記憶體樣本都是整個 isolate 的,每一次重置也是。
![graph TB
subgraph ISO["One V8 isolate, 128 MB cap"]
M["Module scope, loaded once"]
D1["Instance A"]
D2["Instance B"]
D3["Instance C"]
end
M --- D1
M --- D2
M --- D3
D3 -->|"heap crosses 128 MB"| R["exceededMemory, C is reset"]
style M fill:#fee2e2,stroke:#fca5a5,color:#7f1d1d
style R fill:#fee2e2,stroke:#fca5a5,color:#7f1d1d](/diagrams/79348818.svg)
沒有辦法把記憶體剖析器附加到生產環境的 Durable Object 上:Cloudflare 文件中的 heap 快照工具是針對本機開發階段執行的。在 Kubernetes 裡你會開啟剖析並附加上去,直到找到問題。在 workerd 裡,process.memoryUsage() 是一個回傳零的 unenv polyfill,而基準記憶體與 CPU 數字對在裡面執行的程式碼是不可見的。你能拿到的是 Cloudflare 的 GraphQL 分析 API:每個 namespace 的記憶體百分位數與當機次數,事後才有。
記憶體圖告訴了我們什麼
Cloudflare 的分析 API 以執行該 namespace 的各個 isolate 的百分位數回報 Durable Object namespace 的記憶體,以十五分鐘為一個 bucket,並附上每個 bucket 中記憶體超限錯誤的次數。本文中的每一張圖都來自那個 API,篩選到對話串的 namespace,並在我們開始交付修復後跨部署標記進行比較。
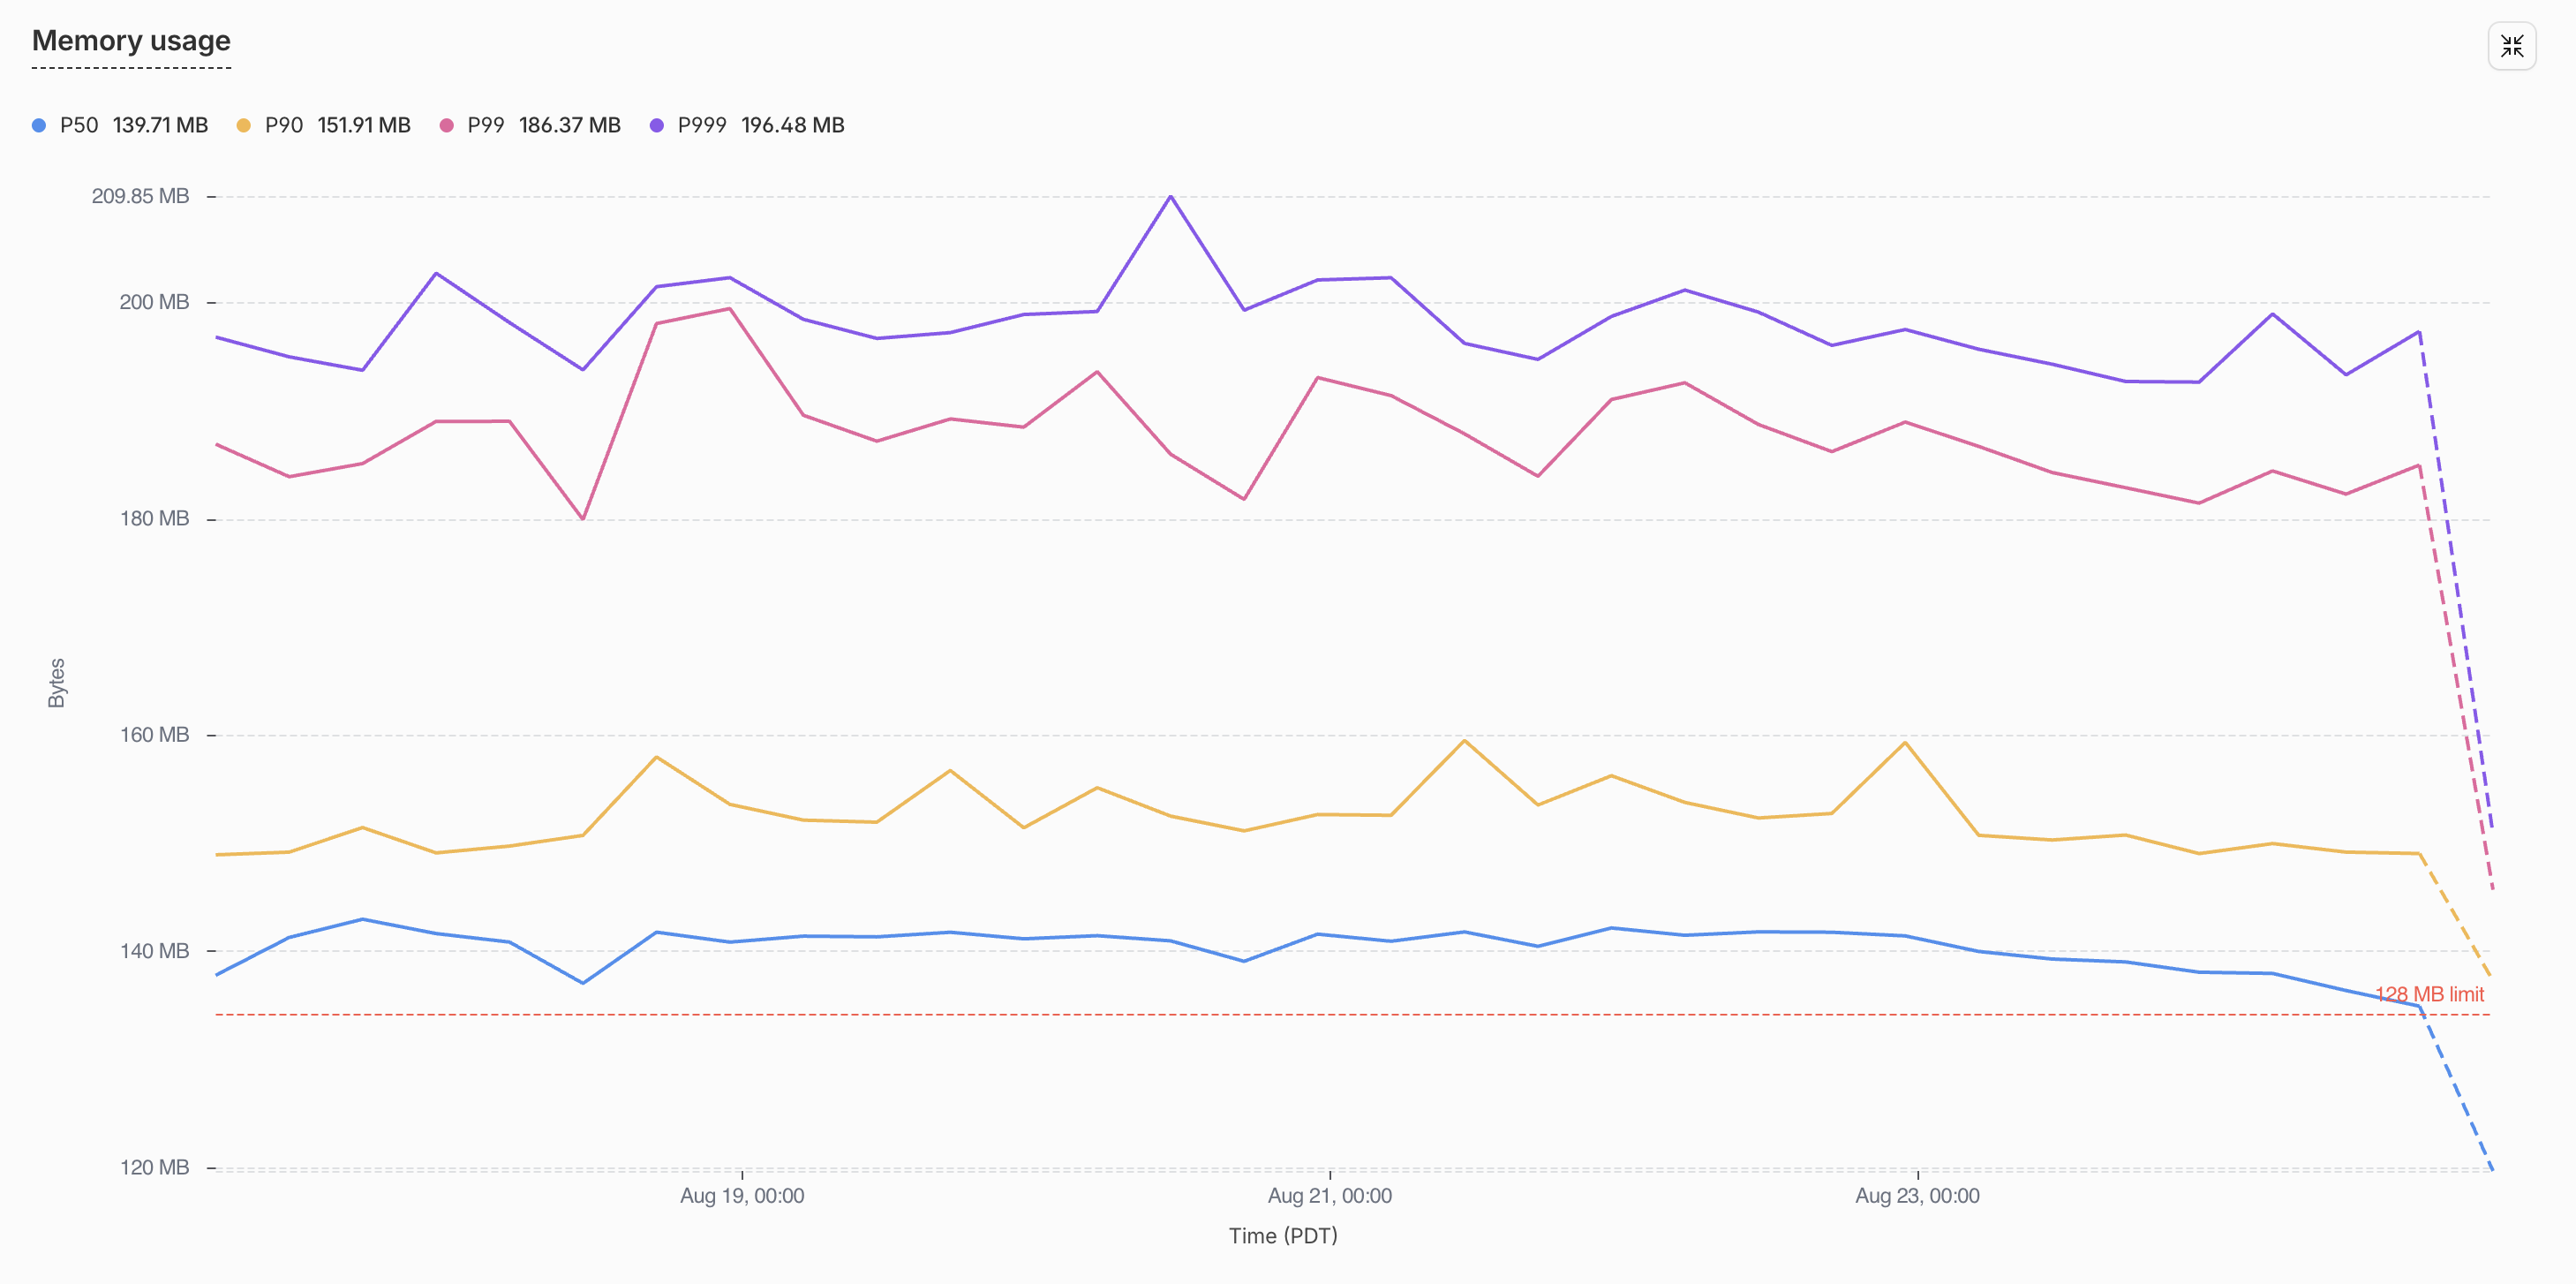
中位數 isolate,也就是圖 1 中的藍線,整週都坐在約 140 MB,而第 99 百分位數坐在接近 190 MB。兩條線都高於虛線標示的 128 MB 限制,這意味著該 namespace 中典型的 isolate 早就過了 Cloudflare 有權重置它的那個點,只是在下一次配置把它推過去之前暫時倖免。這張圖沒有顯示的是任何與流量的關係。安靜時段的線和忙碌時段一樣平,而每天大約 300 次重置中沒有一次帶有堆疊追蹤,因為拋出的從來不是我們的程式碼。
我們先看了你會預期先看的地方。我們讀了 payload 大小,檢查了聊天歷史如何被截斷,並在記憶體曲線中搜尋請求模式,結果什麼都沒找到能讓那條線動起來。那份平坦最後成了重要的線索。isolate 的記憶體是兩者之一:它是資料,也就是請求 payload、聊天歷史、工具輸出,以及服務流量時配置的任何其他東西;或者它是基準,也就是程式碼本身在模組載入時建立並在 isolate 生命週期內一直保持存活的物件,例如 import、函式與 schema。資料隨請求起落,而基準在第一個請求之前就在那裡,永遠不會消失,所以一張在閒置時又高又平的圖描述的是基準。問題一定在我們交付的東西裡,而不是我們服務的東西裡。
![graph TB
H["Isolate heap"] --> B["Baseline: built at module load"]
H --> D["Data: allocated per request"]
B --> B1["imports"]
B --> B2["tool schemas"]
B --> B3["package barrels"]
D --> D1["payloads"]
D --> D2["chat history"]
D --> D3["tool outputs"]
style B fill:#fee2e2,stroke:#fca5a5,color:#7f1d1d](/diagrams/bf60aa6a.svg)
為什麼基準記憶體如此容易被忽略
基準記憶體藏在兩個你平常不會去看的地方。
第一個是打包工具。我們假設 tree shaking 會移除我們不用的程式碼,多數時候也確實如此,但 esbuild 對何時可以修剪有自己的規則,而那些規則不是你猜的那樣。package.json 裡沒有 "sideEffects": false 的套件完全不會被修剪。延遲求值模組內的 export * 也永遠不會被修剪。對套件根目錄的動態 import() 會把每一個 export 都標記為已使用。我們會在修復部分逐一回到這些點,因為它們解釋了那 130 MB 的一半。
// Three ways to keep every zod schema in a package alive in the isolate,
// none of which look like a mistake.

// The package has no "sideEffects": false, so nothing in it is pruned.
import { getWorkspaceStub } from "@scope/durable-workspaces";

// Inside a lazily evaluated module, export * is never pruned.
export * from "./zod";

// A namespace object marks every export as used, schemas included.
const pkg = await import("@scope/durable-workspaces");
第二個是 schema 函式庫。型別感覺是免費的,因為它們在編譯時消失,但 zod schema 不是型別,它是一棵在模組求值那一刻就建好的閉包樹。一個中等大小的 zod 4 物件 schema,十幾個帶描述與 refinement 的欄位,要花掉約 134 KB 的 heap。一個光禿的 z.string() 要花約 12 KB。等價的純 JSON schema 物件只要幾百個位元組。這些都不在 README 裡。
// What each of these costs the moment its module evaluates.
const Params = z.object({                     // ~134 KB for a dozen fields like these
  owner: z.string().describe("Repository owner"),
  repo: z.string().describe("Repository name"),
  pullNumber: z.number().int().describe("PR number"),
});
const Name = z.string();                      // ~12 KB

const params = {                              // a few hundred bytes
  type: "object",
  properties: { owner: { type: "string" }, repo: { type: "string" } },
} as const;
我們沒做任何特別的事
我們的每一個問題都來自預設值。每一個代理工具都在模組範圍用 z.object() 宣告它的輸入,因為文件就是這麼做的。每一個內部套件都有一個帶 export * from "./zod" 的 barrel index.ts,因為這樣很整齊。少數路徑使用 await import("@scope/package"),因為延遲載入理應更便宜。每一個單獨看都是合理的選擇。加在一起就是 130 MB,在一個只有 128 可花的 isolate 裡。
// packages/tools/src/github/get-pull-request.ts, and 250 more like it
export const parameters = z.object({
  owner: z.string().describe("Repository owner"),
  repo: z.string().describe("Repository name"),
  pullNumber: z.number().int().describe("PR number"),
});

// packages/thread-core/src/index.ts, and every other internal package
export * from "./zod";
export * from "./thread";

// packages/durable-threads/src/agent.ts
const { getWorkspaceStub } = await import("@scope/durable-workspaces");
它讓我們付出了什麼代價
我們的代理有超過 250 個工具,透過 code mode 與動態 worker 使用。光是它們的 zod 定義在模組載入時就要花掉 78 MB 的 heap,超過 isolate 預算的一半,全花在對參數的描述上,而它們中任何一個都還沒被呼叫。我們新增的每一個工具都再多花約 134 KB,無論那個工具是否曾經執行過。
250+ tools × ~134 KB of zod each   ≈  78 MB   evaluated before the first request
128 MB isolate cap − 78 MB         =  50 MB   left for every thread's actual data
重置也不是免費的。每一次 exceededMemory 都會丟掉一個進行中的代理回合:一次重試、第二次模型呼叫、一個盯著轉圈圈的使用者。一天約 300 次,這就不再是一次事件,而變成一筆常態稅,而且由於共置,付這筆稅的是當時剛好在該 isolate 裡的任何一個物件。
Error: Durable Object's isolate exceeded its memory limit and was reset.我們如何找到它:一個針對生產環境 bundle 的 heap 剖析器
我們無法剖析生產環境,所以我們做了一個小剖析器,在本機對生產環境實際執行的那個 bundle 執行。它量測求值每一個模組的 V8 heap 成本,並印出一張排序表。我們循環執行它:剖析、移除排名最上面的、再剖析。每一個修復的最終驗證是一次生產環境部署,對照部署標記兩側 Cloudflare 的記憶體指標。
![graph TB
A["wrangler deploy --dry-run"] --> B["production bundle + metafile"]
B --> C["instrument the __esm helper"]
C --> D["run under Node with stubs"]
D --> E["exclusive heap per module"]
style E fill:#d1fae5,stroke:#6ee7b7,color:#065f46](/diagrams/0b647474.svg)
三個想法讓它成立:
- 同一個 bundle。
wrangler deploy --dry-run --outdir --metafile會產出部署時會上傳的那個確切 esbuild bundle,加上它的模組圖。一切都在那個 bundle 上量測。 - 模組歸屬。 esbuild 把延遲求值的模組包在
__esm(...)初始化閉包裡。我們在建好的 bundle 中重寫那唯一一個 helper,讓每一次模組初始化在自身前後記錄v8.getHeapStatistics().used_heap_size,並用一個初始化堆疊把模組自己的成本(exclusive)與其依賴的成本(inclusive)分開。結果是一份火焰圖形狀的資料集。 - 受控的執行。 被儀器化的 bundle 在純 Node 下執行,搭配一個把
cloudflare:*import 解析到 stub 的 loader shim。
完整的配方,可以直接貼進程式碼代理,在本文最後。上面引用的 zod 單位成本來自透過同一個 harness 執行的微型基準測試。
第一次剖析顯示了什麼
| 來源 | Exclusive heap |
|---|---|
packages/tools(250+ 個代理工具定義,zod) | 78.0 MB |
| 重新匯出 zod schema 模組的套件 barrel(以下各列) | ~66 MB |
durable-workspaces(工作區狀態與排程) | 15.6 MB |
thread-core(對話串資料層) | 10.1 MB |
durable-automations(自動化定義) | 9.6 MB |
durable-threads(對話串清單與即時更新) | 7.3 MB |
durable-automation(一次自動化執行) | 6.8 MB |
db(D1 用戶端與模型) | 6.3 MB |
durable-skills(技能定義) | 5.7 MB |
durable-autofixes(自動修復分支與合併) | 4.9 MB |
| 12 個較小的套件 | ~9 MB |
第二列是令人意外的那一列。那些是只透過套件 barrel 中的 export * from "./zod" 進入 bundle 的 schema。我們的程式碼從未使用它們,tree shaker 無法移除它們,而它們花掉了記憶體限制的三分之一,全都在從未被任何東西呼叫的模組裡。
修復 A:把工具定義當成資料,而不是程式碼
每一個工具定義都用 zod 宣告輸入 schema,並在執行期轉換為 JSON schema,因為送給模型的本來就是 JSON schema。我們為了產生幾百個位元組的資料,替每個工具建了約 134 KB 的閉包,所以我們直接把資料寫出來。
![graph TB
Z["zod schema, ~134 KB per tool"] --> J["toJSONSchema() at runtime"]
J --> M["JSON schema sent to the model"]
D["JSON schema, ~0.3 KB per tool"] --> M
style Z fill:#fee2e2,stroke:#fca5a5,color:#7f1d1d
style D fill:#d1fae5,stroke:#6ee7b7,color:#065f46](/diagrams/5f84b543.svg)
// before: ~134 KB of closures per tool, built at module load
export const parameters = z.object({
  owner: z.string().describe("Repository owner"),
  repo: z.string().describe("Repository name"),
  pullNumber: z.number().int().describe("PR number"),
});

// after: a few hundred bytes of data, and the type comes from the schema
export const parameters = defineParameters({
  type: "object",
  properties: {
    owner: { type: "string", description: "Repository owner" },
    repo: { type: "string", description: "Repository name" },
    pullNumber: { type: "number", description: "PR number" },
  },
  required: ["owner", "repo", "pullNumber"],
} as const);
export type Input = ParametersInput<typeof parameters>;
defineParameters 是 AI SDK 的 jsonSchema() 之上的一層薄包裝。ParametersInput 是 json-schema-to-ts 在做 zod 以前做的型別推論。執行期驗證移到一個約 300 行的驗證器,重現代理迴圈所依賴的特性:剝除未知鍵、填入預設值、以 discriminator 解析 union,並把錯誤訊息寫成讓模型能在重試時修好自己的工具呼叫。
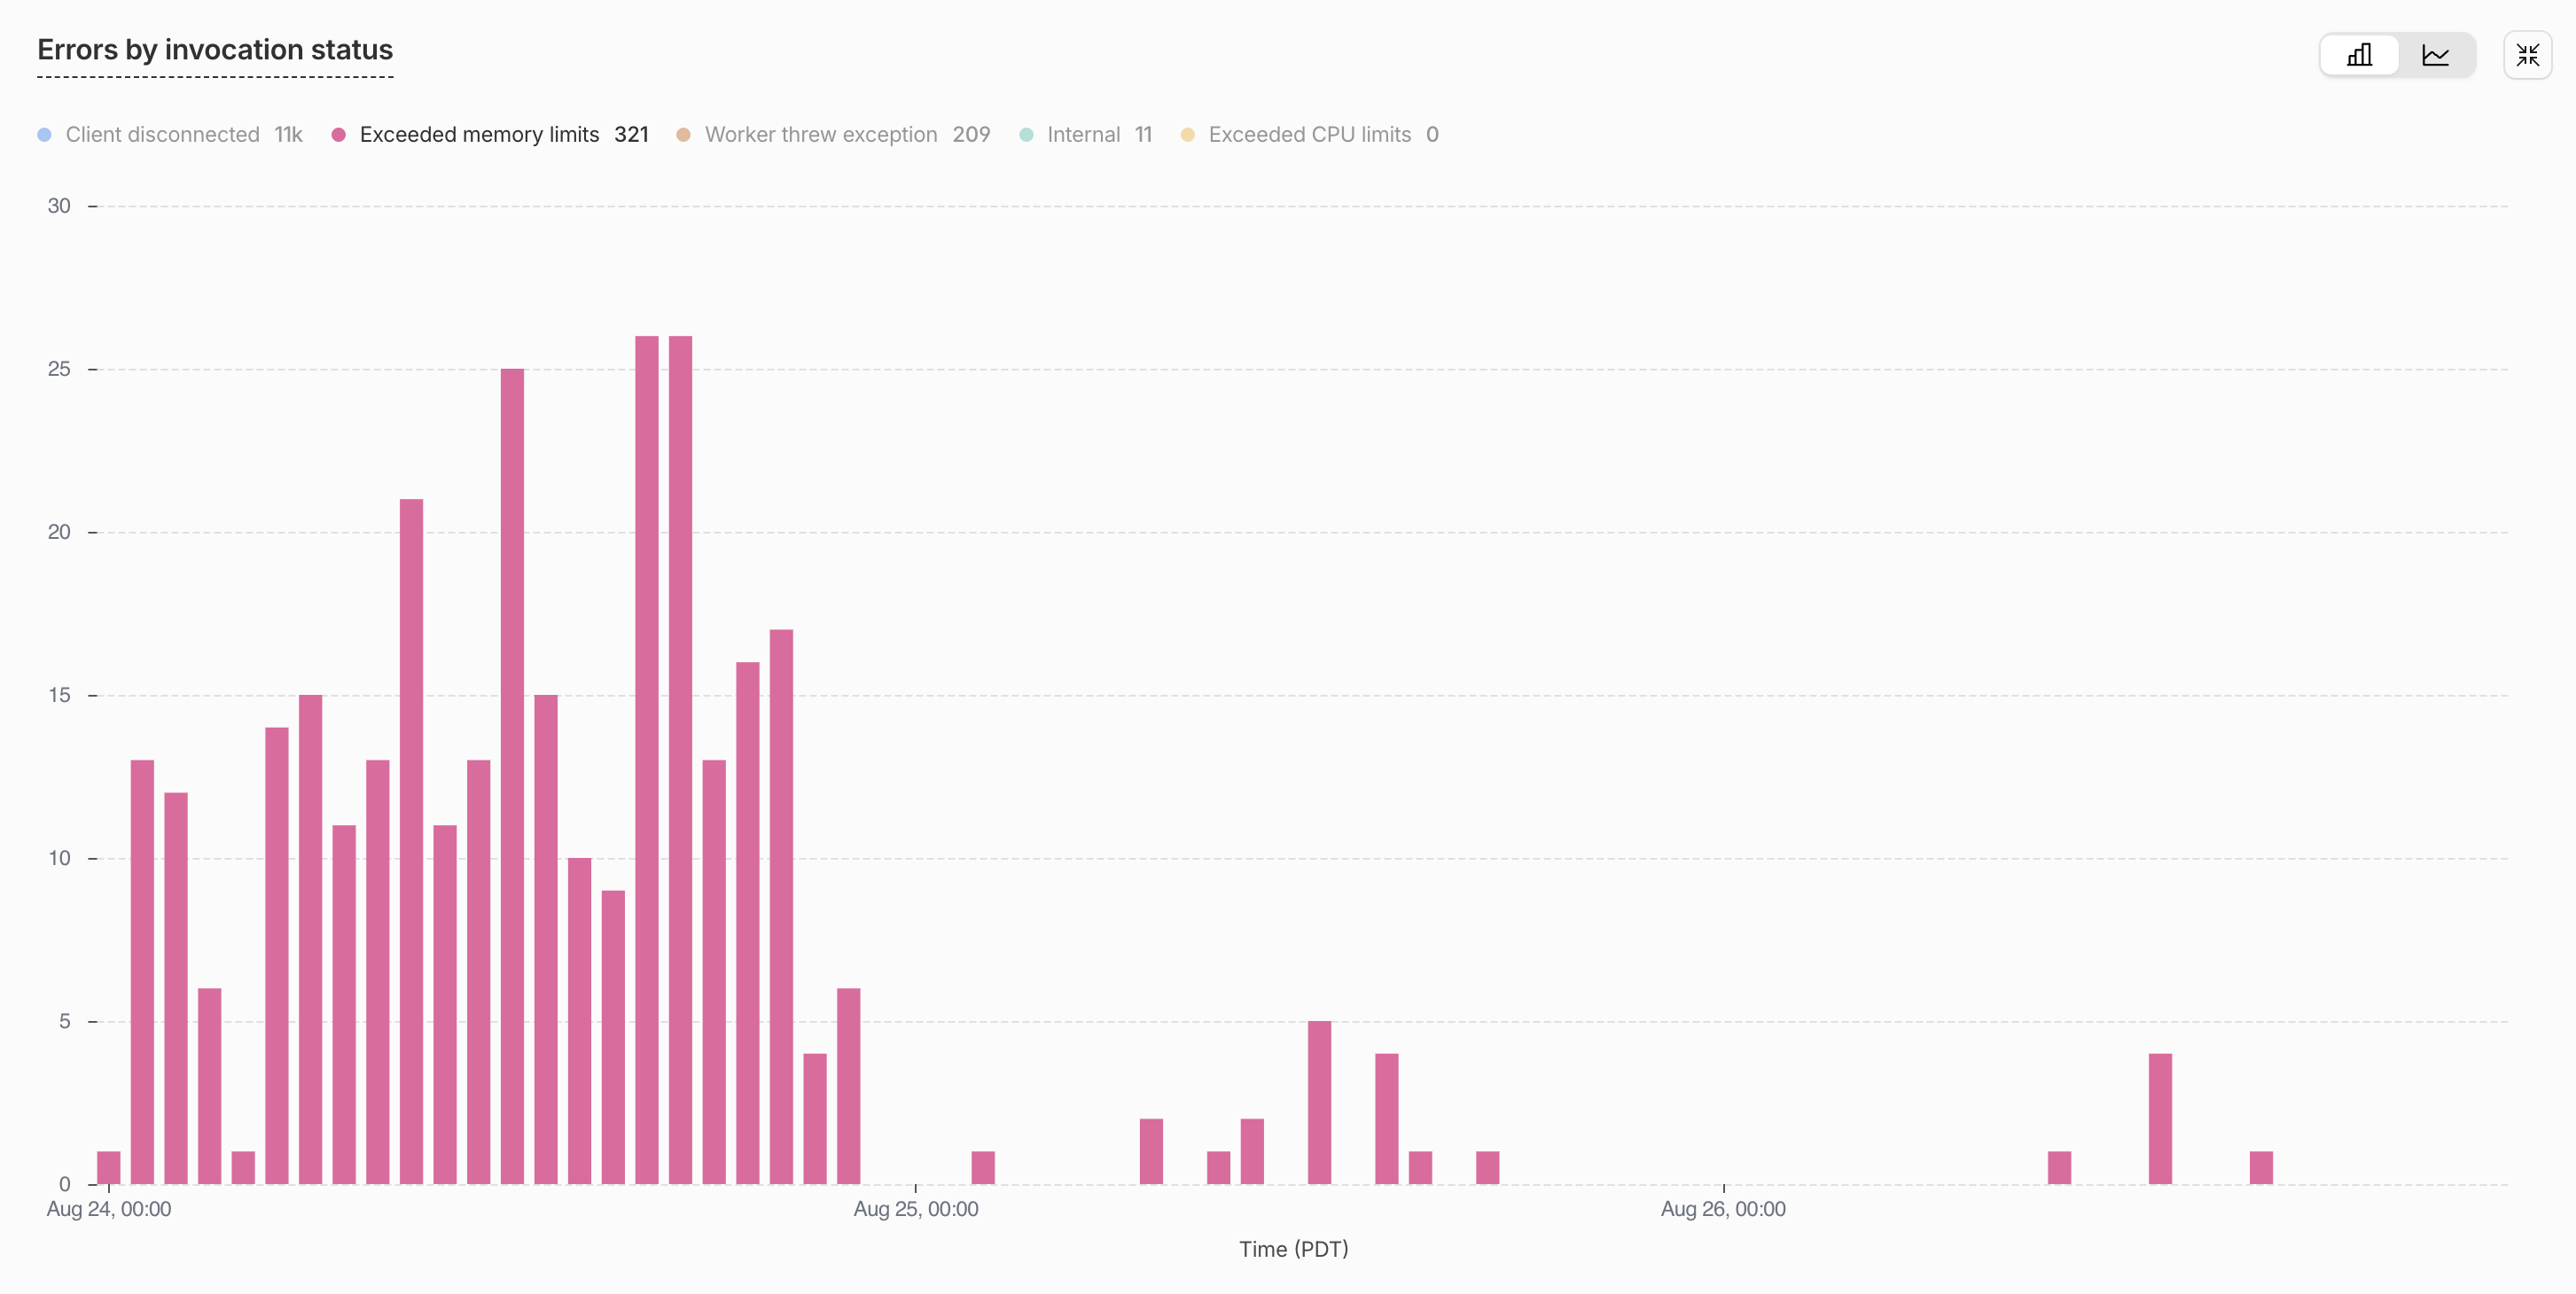
模組求值 heap 在本機從 218.6 降到 154.0 MB,packages/tools 從 78 MB 降到 0.7 MB。在生產環境中,重置在部署標記處從每小時 40 到 110 次降到每小時 0 到 6 次,中位數 isolate 的記憶體從約 140 MB 降到約 120 MB。
修復 B:真的能被 tree-shake 的 barrel
剩下的約 66 MB 是 isolate 從未使用的 schema。三個打包工具的行為解釋了它:
- 套件的
package.json裡沒有"sideEffects": false時,esbuild 對它什麼都不修剪。 - 即使有這個旗標,延遲求值模組內的
export * from "./zod"也永遠不會被修剪,而透過動態import()可達的任何東西都是延遲求值的。具名重新匯出(export { zFoo } from "./zod")則能正常修剪。 await import("@scope/package")會實體化該套件的整個 namespace 物件,把每一個 export 都標記為已使用:schema、類別,一切。
我們用一個以 wrangler 內嵌的 esbuild 版本建置的五檔案 fixture 逐一確認了這些:一個 entry、一個帶 index.ts barrel 的套件、一個 zod.ts 持有一個會在建構時宣告自己執行的 schema、一個匯入該 schema 的 do.ts 類別,以及它們之間的一個延遲中介。表格記錄了每種組合下 schema 的建構子是否在求值時執行。
| Entry 匯入 barrel 的方式 | Barrel 重新匯出的形態 | sideEffects: false | 包含 schema |
|---|---|---|---|
| 靜態 import | export * | 是 | 否 |
| 靜態 import | export * | 否 | 是 |
對套件的動態 import() | 任意 | 是 | 是 |
| 從延遲載入模組的靜態 import | export * | 是 | 是 |
| 從延遲載入模組的靜態 import | 具名清單 | 是 | 否 |
| 任意 | 具名清單 | 否 | 是 |
第 3 列與第 4 列是讓人意外的兩列,它們加起來就是那約 66 MB。這是一個 barrel 對我們做的事:
![graph TB
A["do.ts imports one function"] --> B["durable-workspaces barrel"]
B -->|"export * from './zod'"| C["zod/*.ts, 15.6 MB of schemas"]
B -->|"used"| D["getWorkspaceStub(), ~1 KB"]
style C fill:#fee2e2,stroke:#fca5a5,color:#7f1d1d
style D fill:#d1fae5,stroke:#6ee7b7,color:#065f46](/diagrams/5d71e80c.svg)
修復是機械性的:在全部 110 多個工作區套件加上 "sideEffects": false,把 barrel 的 export * 改寫為具名重新匯出清單,並把對套件根目錄的 await import("@scope/package") 換成靜態具名 import。
在真實生產環境 bundle 上的消融實驗顯示每一部分都是必要的。
| 設定 | 模組求值後的 heap | Bundle 中的 schema 模組 |
|---|---|---|
| 基準(修復 A 之後) | 154.0 MB | 77 |
只有 sideEffects: false | 143.6 MB | 77 |
+ 靜態 import,barrel 改回 export *(對照組) | 98.6 MB | 29 |
| + 具名重新匯出清單(完整修復) | 82.1 MB | 0 |
對照組那一列是有意思的:即使是完全靜態的 import 圖也留下了 29 個 schema 模組,所以具名清單不是可選的。
最終狀態
| 模組範圍 heap(本機探測) | 生產環境中位數記憶體 | 生產環境重置 | |
|---|---|---|---|
| 修復前 | 218.6 MB | ~140 MB | 約 300 次/天 |
| 修復 A 後 | 154.0 MB | ~120 MB | 約 10 次/天 |
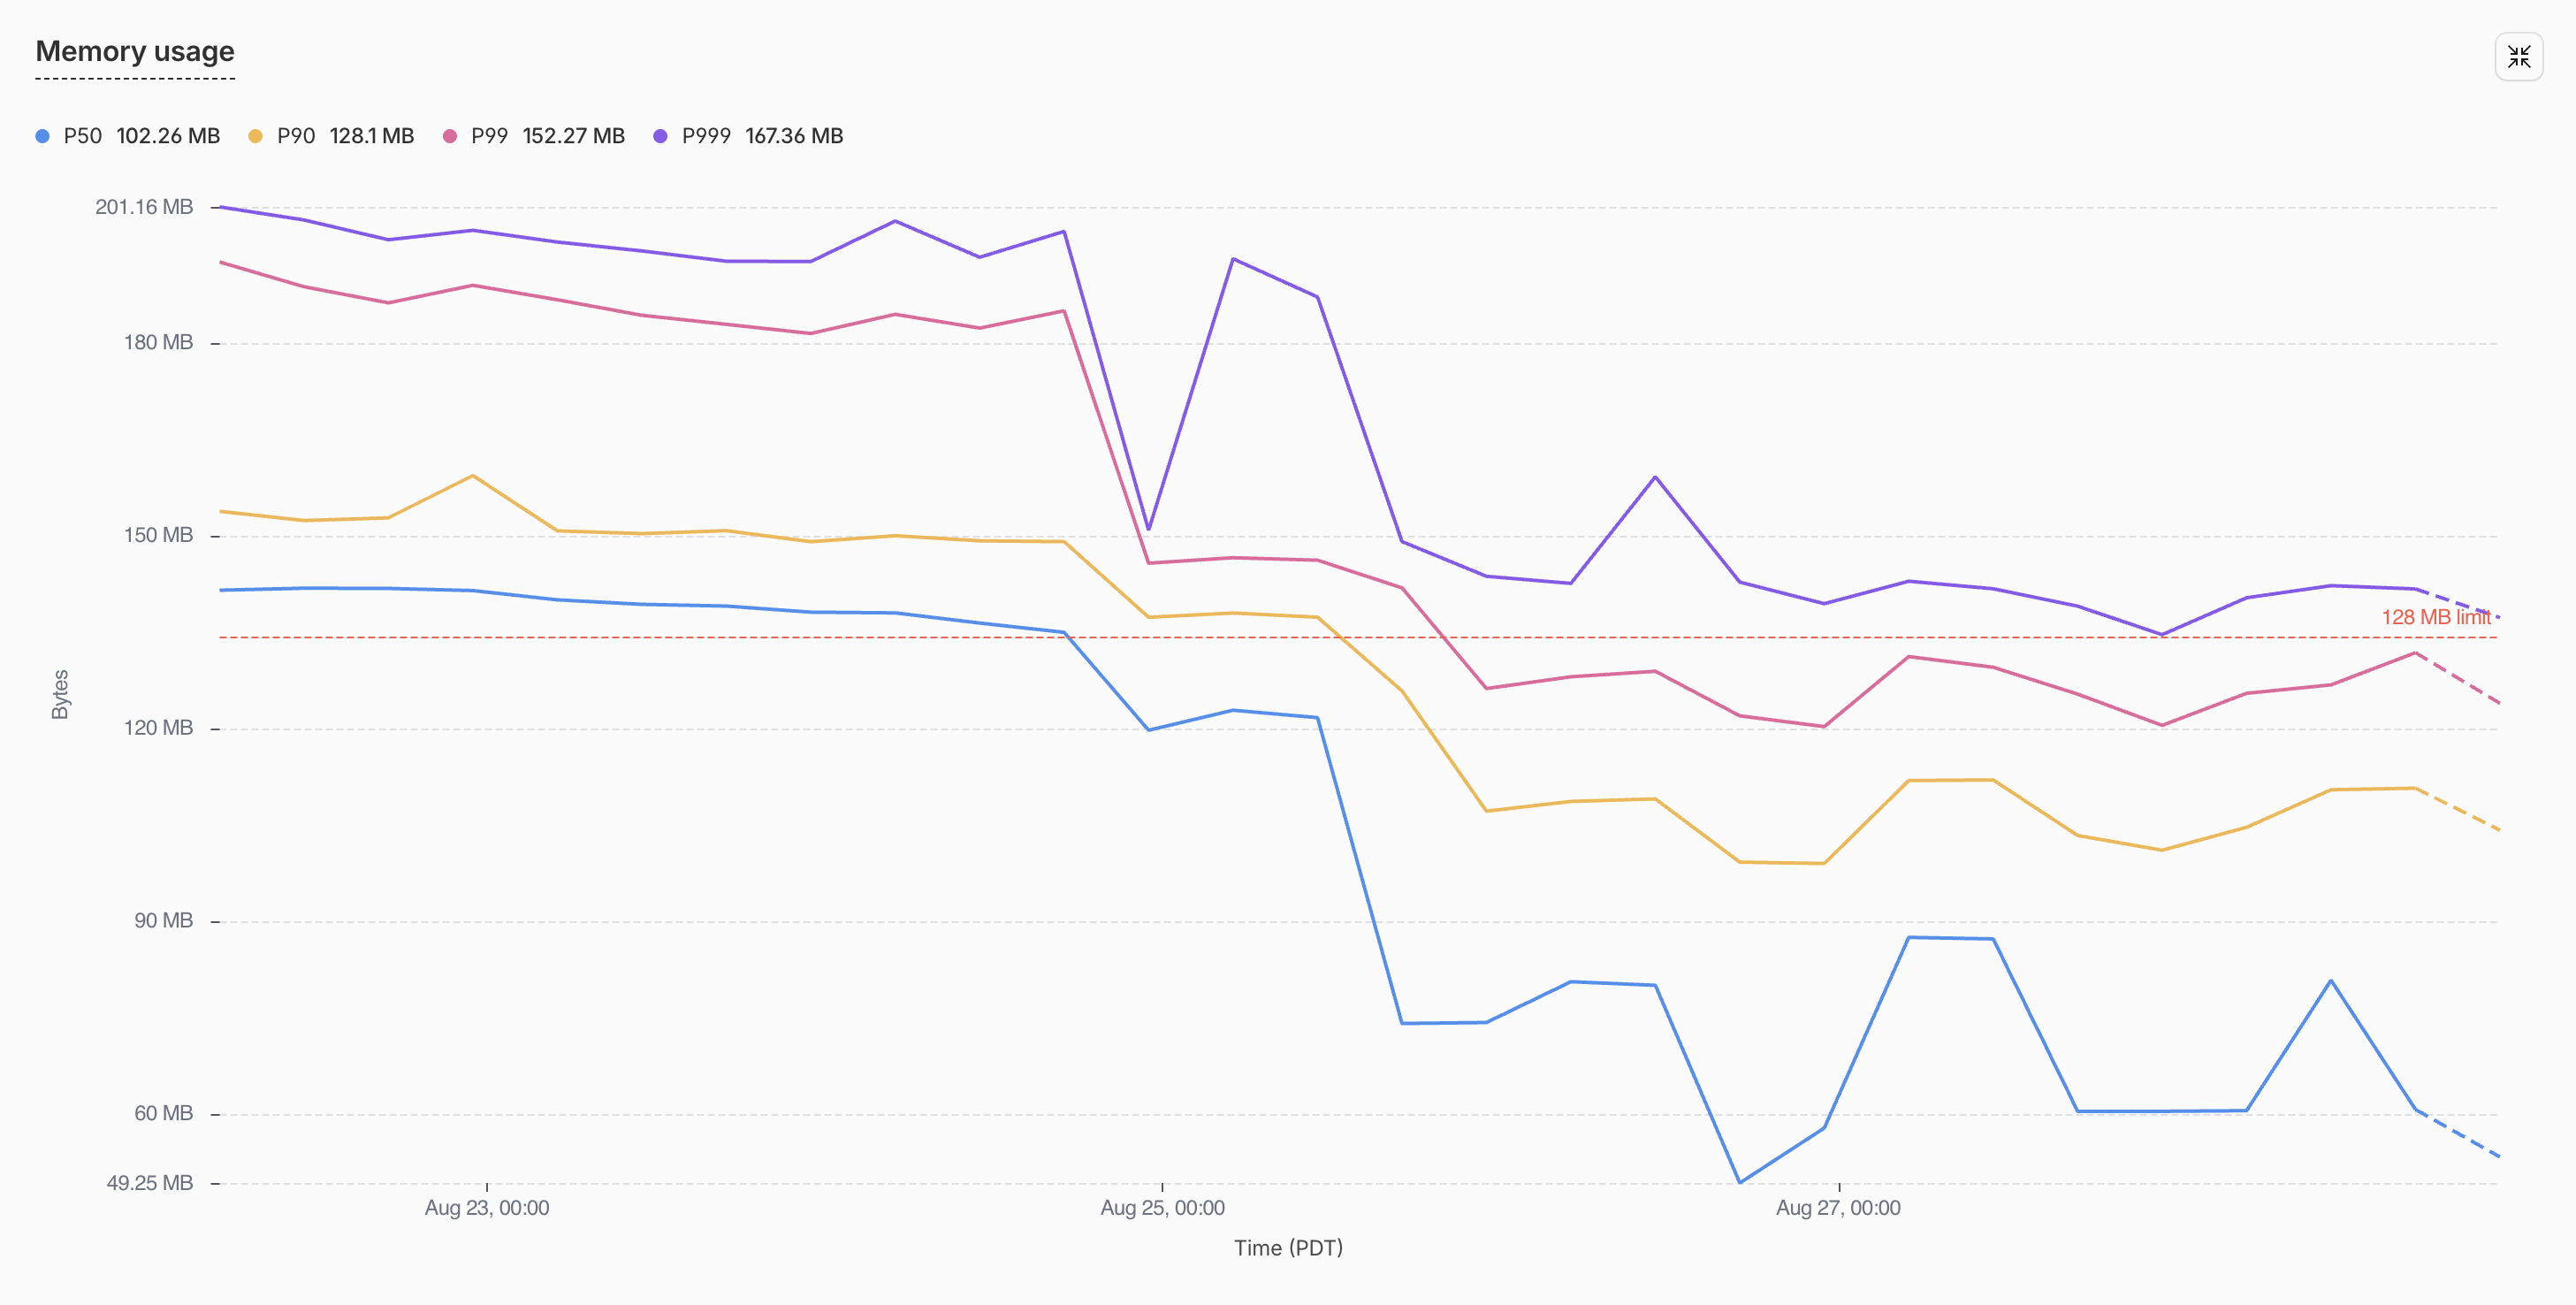
| 修復 A+B 後 | 82.1 MB | ~70 MB | 0 |
一個閒置時就高於平台記憶體限制的 Durable Object,現在閒置時只用到限制的一半左右,每天約 300 次的重置也消失了。
這不是一個設定旗標
把超過 250 個工具定義從 zod 改寫為原始 JSON schema,並寫一個 300 行的驗證器取代 zod 為我們做的事,花了幾天,即使有程式碼代理幫忙。在超過 100 個套件加上 sideEffects: false,並把每一個 export * 變成產生出來的具名清單,是不光彩的苦工,而且之後你得對整個 repo 做型別檢查並修好壞掉的東西。簡單的替代方案是加個重試然後與重置共存,很多團隊也確實這麼做。如果你的 Durable Object 在閒置時就接近限制,我會說這一週值得,因為限制不會動,而你的工具數量只會往上。
三件我希望從第一天就知道的事:
- 閒置時又高又平就是基準。 剖析你交付的東西,而不是你服務的東西。
- Tree shaking 有規則。
sideEffects: false、具名重新匯出、靜態 import。漏掉一個,整個套件就跟著進來。 - Schema 是程式碼,不是型別。 如果消費端要的是 JSON schema,就寫 JSON schema。
今天就這麼做,修好你 Durable Object 的記憶體
這個剖析器約 100 行,除了 Node 與 wrangler 之外沒有其他依賴。把下面的配方貼進你程式碼代理裡,在任何用 wrangler 部署的 repo 根目錄執行,讀它印出的表格前十列,看看裡面有什麼。然後沿著清單往下做:任何模型本來就以 JSON schema 接收的東西改用純 JSON schema,barrel 加上 "sideEffects": false 與具名重新匯出,套件根目錄改用靜態 import。
Build a per-module heap profiler for my worker's production bundle.

1. Emit the exact production bundle and metafile:

   cd <worker-dir>
   npx wrangler deploy --dry-run --env <stage> --config wrangler.jsonc \
     --outdir /tmp/heap-probe --metafile /tmp/heap-probe/meta.json

   If the worker's import graph is fully static, esbuild emits no lazy
   `__esm` wrappers and per-module attribution is impossible. In that case
   build from a probe-only entry that reaches the real entry through a
   dynamic import (and satisfies wrangler's Durable Object export check
   with a placeholder class):

   // probe-entry.ts
   export default { fetch: () => new Response("probe") };
   export class <YourDurableObjectClassName> {}
   export const probeLoad = () => import("<path-to-real-entry>");

   npx wrangler deploy --dry-run --env <stage> --config wrangler.jsonc \
     --outdir /tmp/heap-probe --metafile /tmp/heap-probe/meta.json probe-entry.ts

2. Instrument the bundle. Write instrument.mjs and run
   `node instrument.mjs /tmp/heap-probe`:

   import { readFileSync, writeFileSync } from "node:fs";
   import { join } from "node:path";

   const outDir = process.argv[2];
   const bundlePath = join(outDir, "probe-entry.js"); // or index.js
   const source = readFileSync(bundlePath, "utf-8");

   const esmHelperPattern = /var __esm = \(fn, res(?:, \w+)?\) => function __init\(\) \{[\s\S]*?\n\};\n/;
   if (!esmHelperPattern.test(source)) throw new Error("__esm helper not found; esbuild output shape changed");

   const instrumentedHelper = `var __probeInitStack = [];
   var __esm = (fn, res, err2) => function __init() {
     if (err2) throw err2[0];
     if (!fn) return res;
     const probe = globalThis.__moduleHeapProbe;
     if (!probe) {
       try { return (res = (0, fn[__getOwnPropNames(fn)[0]])(fn = 0)), res; }
       catch (e) { throw ((err2 = [e]), e); }
     }
     const moduleName = __getOwnPropNames(fn)[0];
     const frame = { child: 0 };
     const before = probe.heap();
     __probeInitStack.push(frame);
     try { return (res = (0, fn[moduleName])(fn = 0)), res; }
     catch (e) { throw ((err2 = [e]), e); }
     finally {
       const total = probe.heap() - before;
       __probeInitStack.pop();
       if (__probeInitStack.length > 0) __probeInitStack[__probeInitStack.length - 1].child += total;
       probe.record(moduleName, total - frame.child, total);
     }
   };
   `;
   writeFileSync(join(outDir, "instrumented.mjs"), source.replace(esmHelperPattern, instrumentedHelper));

3. Write a Node loader shim so worker-targeted code loads under Node.
   register.mjs resolves `cloudflare:*` to a stub module (an empty module
   exporting throwing placeholders for DurableObject, WorkerEntrypoint,
   env, etc.) via module.registerHooks; add a `load` hook for any
   non-JS rules in your wrangler config (for us: `.sql` files become
   text default exports, mirroring wrangler's Text rule).

4. Write probe.mjs and run it:

   node --expose-gc --import ./register.mjs probe.mjs /tmp/heap-probe

   import { join } from "node:path";
   import { pathToFileURL } from "node:url";
   import v8 from "node:v8";

   const outDir = process.argv[2];
   const records = [];
   globalThis.__moduleHeapProbe = {
     heap: () => v8.getHeapStatistics().used_heap_size,
     record: (moduleName, exclusive, total) => records.push({ moduleName, exclusive, total }),
   };
   const settle = async () => { await new Promise((r) => setTimeout(r, 0)); globalThis.gc(); globalThis.gc(); };
   const mb = (b) => (b / 1048576).toFixed(2);

   await settle();
   const bundle = await import(pathToFileURL(join(outDir, "instrumented.mjs")).href);
   if (bundle.probeLoad) await bundle.probeLoad();
   await settle();
   console.log(`heap after module evaluation: ${mb(v8.getHeapStatistics().used_heap_size)} MB`);

   for (const r of records.sort((a, b) => b.exclusive - a.exclusive).slice(0, 40))
     console.log(`${mb(r.exclusive).padStart(8)} MB  ${r.moduleName}`);

   const byPackage = new Map();
   for (const r of records) {
     const m = r.moduleName.match(/node_modules\/((?:@[^/]+\/)?[^/]+)|(packages\/[^/]+)/);
     const key = m ? (m[1] ? `npm:${m[1]}` : m[2]) : "other";
     byPackage.set(key, (byPackage.get(key) ?? 0) + r.exclusive);
   }
   for (const [k, v] of [...byPackage.entries()].sort((a, b) => b[1] - a[1]))
     if (v > 131072) console.log(`${mb(v).padStart(8)} MB  ${k}`);

5. Gotchas that will otherwise burn an afternoon:
   - The bundle's unenv polyfill replaces globalThis.process at init and its
     memoryUsage() reports zeros. Read v8.getHeapStatistics() instead.
   - Compare deltas between runs of this probe, never absolutes against
     production: Node's heap baseline differs from workerd's.
   - Modules evaluated eagerly at the top level (not wrapped in __esm) are
     invisible to attribution; the probe-entry trick in step 1 fixes that.
如果你想讓整個稽核替你做完,這是一個給你程式碼代理的技能:
Audit this repo's worker bundles for module-scope schema weight, and fix what you find. Work in this order and show me numbers at every step.

1. Baseline. Using the "profile module-scope heap" recipe, build the
   production bundle of our most memory-sensitive worker and produce the
   per-module and per-package exclusive-heap ranking. Report heap after
   module evaluation.

2. Identify schema weight. From the ranking and the esbuild metafile, list
   every module matching your schema conventions (zod/valibot/etc. modules,
   e.g. packages/*/zod*) that survived into the bundle, with bytes. For each,
   compute one import chain from the entry using the metafile's `imports`
   graph (BFS), so we know *why* it is in the bundle.

3. Classify each surviving schema module:
   a. Actually used at runtime by this worker: leave it, or move the boundary.
   b. Reached through `export *` in a package barrel: candidate for named lists.
   c. Reached through `await import("<package root>")`: candidate for a static
      named import.
   d. Reached because the package lacks `"sideEffects": false`: candidate flag.

4. Apply, in this order, re-profiling after each:
   a. Add `"sideEffects": false` to every internal package that has no
      import-time side effects. Audit first: grep package sources for
      top-level globalThis mutations, addEventListener, polyfill assignment.
      Any true side-effect file gets `"sideEffects": ["./that-file.ts"]`.
   b. Rewrite `export * from "./<schemas>"` in package barrels to explicit
      `export { ... }` / `export type { ... }` lists. Generate the lists with
      the TypeScript compiler API (walk ExportDeclarations recursively,
      classify value vs type), never by regex. Typecheck the repo after.
   c. Replace every value-position `await import("@scope/pkg")` of a bare
      package root with a static named import of the symbols actually used.
      Check the site is not lazy for a *different* reason first (circular
      imports, Node-only test loading, genuine cold-path npm dependency).

5. If tool/LLM definitions build schema-library objects at module scope,
   propose converting them to plain JSON schema with types via
   json-schema-to-ts, and estimate the saving from step 1's ranking before
   doing it.

6. Verify: re-profile (report the delta), typecheck, run the affected
   packages' tests, and dry-run build every worker. Then add a CI assertion
   that reads the metafile of the memory-sensitive worker and fails if any
   schema module survives tree shaking into it, printing the import chain.

7. After deploy, compare the platform memory metrics across the deploy
   marker and report before/after median and 99th percentile memory, and reset
   counts.
我們也把這個技能加進了 Polylane 本身,所以每一位 Polylane 使用者開箱就能對他們的 Durable Object 記憶體進行這種深度調查,什麼都不用貼。