

เราแก้ error Memory Exceeded ของ Cloudflare Durable Objects ได้อย่างไร
Explore with AI
ทุกเธรดของเอเจนต์ใน Polylane รันภายใน Cloudflare Durable Object ของตัวเอง ทั้งหมดเป็น instance ของ class เดียว ในเดือนสิงหาคม 2026 Durable Object ของเธรดของเราถูกรีเซ็ตราว 300 ครั้งต่อวันเพราะเกินขีดจำกัดหน่วยความจำ เราได้ยินเรื่องเดียวกันจากหลายทีมที่รัน flow แบบเอเจนต์บน Cloudflare Durable Objects
ถ้าคุณเคยเจอ exceededMemory บน Durable Object คำแนะนำทั่วไปคือดูว่าคำขอของคุณจัดสรรอะไร: payload ที่ใหญ่เกิน ประวัติแชทที่โตไม่มีขอบเขต cache ที่ไม่เคยเอาออก ไม่มีข้อไหนตรงกับเรา isolate เกินขีดจำกัดก่อนที่จะให้บริการคำขอแรกด้วยซ้ำ น้ำหนักจึงต้องอยู่ในโค้ดที่เราปล่อยออกไป ไม่ใช่ข้อมูลที่เราให้บริการ
โพสต์นี้ว่าด้วยสิ่งที่อยู่ใน heap จริง ๆ เราหามันเจอได้อย่างไรบนแพลตฟอร์มที่ไม่ให้คุณต่อ profiler และการเปลี่ยนแปลงสองอย่างที่พาหน่วยความจำระดับโมดูลจาก 218 MB ลงมาที่ 82 MB และการรีเซ็ตเหลือศูนย์
Cloudflare Durable Objects ในหนึ่งนาที
ถ้าคุณยังไม่เคยใช้: Durable Object คือเซิร์ฟเวอร์ขนาดเล็กที่มีสถานะ ทำงานเธรดเดียว ซึ่ง Cloudflare รับประกันว่ามีเพียงตัวเดียวสำหรับ ID ที่กำหนด เรียก idFromName() ด้วย ID นั้นจาก Worker แล้วทุกคำขอสำหรับมัน จากที่ใดในโลกก็ตาม จะไปลงที่ instance เดียวกัน พร้อมฐานข้อมูล SQLite สถานะในหน่วยความจำ และ alarm ของตัวเอง มันจำศีลเมื่อว่างและตื่นขึ้นตรงจุดที่ค้างไว้
ใน Polylane เราสร้าง instance ของ Durable Object สำหรับแต่ละเธรด ทุกการสนทนากับเอเจนต์ ไม่ว่าคนจะเริ่มหรือ alert จะเริ่ม ได้ Durable Object ของตัวเอง SQLite ของ object ถือข้อความและผลจากเครื่องมือของเธรด ลูปของเอเจนต์รันข้างในมัน และเครื่องมือของมันเรียกออกไปยังผู้ให้บริการที่เธรดต้องใช้: Datadog, Sentry, Honeycomb, GitHub, Cloudflare และที่เหลือ เมื่อเธรดเงียบลง object จะจำศีล และเมื่อข้อความถัดไปมาถึง มันทำต่อตรงจุดที่หยุดไว้พอดี
![graph TB
U["New message or alert"] --> W["Worker"]
W -->|"idFromName(threadId)"| DO["One Durable Object per thread"]
DO --> S["SQLite: messages, tool results"]
DO --> L["Agent loop"]
L --> T["Tools"]
T --> P1["Datadog"]
T --> P2["Sentry"]
T --> P3["Honeycomb"]
T --> P4["GitHub, Cloudflare, ..."]
style DO fill:#d1fae5,stroke:#6ee7b7,color:#065f46](/diagrams/efa7281c.svg)
หน่วยความจำของ Durable Objects ทำงานอย่างไร
- isolate และเพดาน 128 MB Durable Objects รันภายใน V8 isolate และ isolate มีขีดจำกัดหน่วยความจำตายตัวที่ 128 MB ซึ่งเท่ากันทุกแพลนและตั้งค่าไม่ได้
- การอยู่ร่วมกัน isolate เดียวโฮสต์ Durable Object หลายตัวของ class เดียวกัน พร้อมกับโค้ด Worker รอบ ๆ พวกมัน และทั้งหมดใช้หน่วยความจำของ isolate นั้นร่วมกัน ขีดจำกัดเป็นต่อ isolate ไม่ใช่ต่อ object
- เพื่อนบ้านเสียงดัง เพราะการอยู่ร่วมกัน object ที่ถูกรีเซ็ตเมื่อ isolate หน่วยความจำหมด มักไม่ใช่ object ที่ใช้หน่วยความจำนั้น ทุกตัวอย่างหน่วยความจำที่ Cloudflare รายงานคือของทั้ง isolate และทุกการรีเซ็ตก็เช่นกัน
![graph TB
subgraph ISO["One V8 isolate, 128 MB cap"]
M["Module scope, loaded once"]
D1["Instance A"]
D2["Instance B"]
D3["Instance C"]
end
M --- D1
M --- D2
M --- D3
D3 -->|"heap crosses 128 MB"| R["exceededMemory, C is reset"]
style M fill:#fee2e2,stroke:#fca5a5,color:#7f1d1d
style R fill:#fee2e2,stroke:#fca5a5,color:#7f1d1d](/diagrams/79348818.svg)
ไม่มีทางต่อ memory profiler เข้ากับ Durable Object ใน production: เครื่องมือ heap snapshot ที่ Cloudflare มีเอกสารไว้ รันกับเซสชัน dev ในเครื่อง ใน Kubernetes คุณจะเปิดการโปรไฟล์และต่อเข้าไปจนกว่าจะพบปัญหา ใน workerd process.memoryUsage() เป็น polyfill ของ unenv ที่คืนค่าศูนย์ และตัวเลขหน่วยความจำและ CPU พื้นฐานไม่ปรากฏต่อโค้ดที่รันข้างใน สิ่งที่คุณได้คือ GraphQL analytics API ของ Cloudflare: เปอร์เซ็นไทล์ของหน่วยความจำ และจำนวน crash ต่อ namespace หลังจากเกิดเหตุแล้ว
กราฟหน่วยความจำบอกอะไรเรา
analytics API ของ Cloudflare รายงานหน่วยความจำของ namespace ของ Durable Object เป็นเปอร์เซ็นไทล์ทั่ว isolate ที่รันมัน ในช่วงสิบห้านาที พร้อมกับจำนวน error เกินหน่วยความจำในแต่ละช่วง ทุกกราฟในโพสต์นี้มาจาก API นั้น กรองเฉพาะ namespace ของเธรดและเทียบข้ามเครื่องหมาย deploy เมื่อเราเริ่มปล่อยการแก้ไข
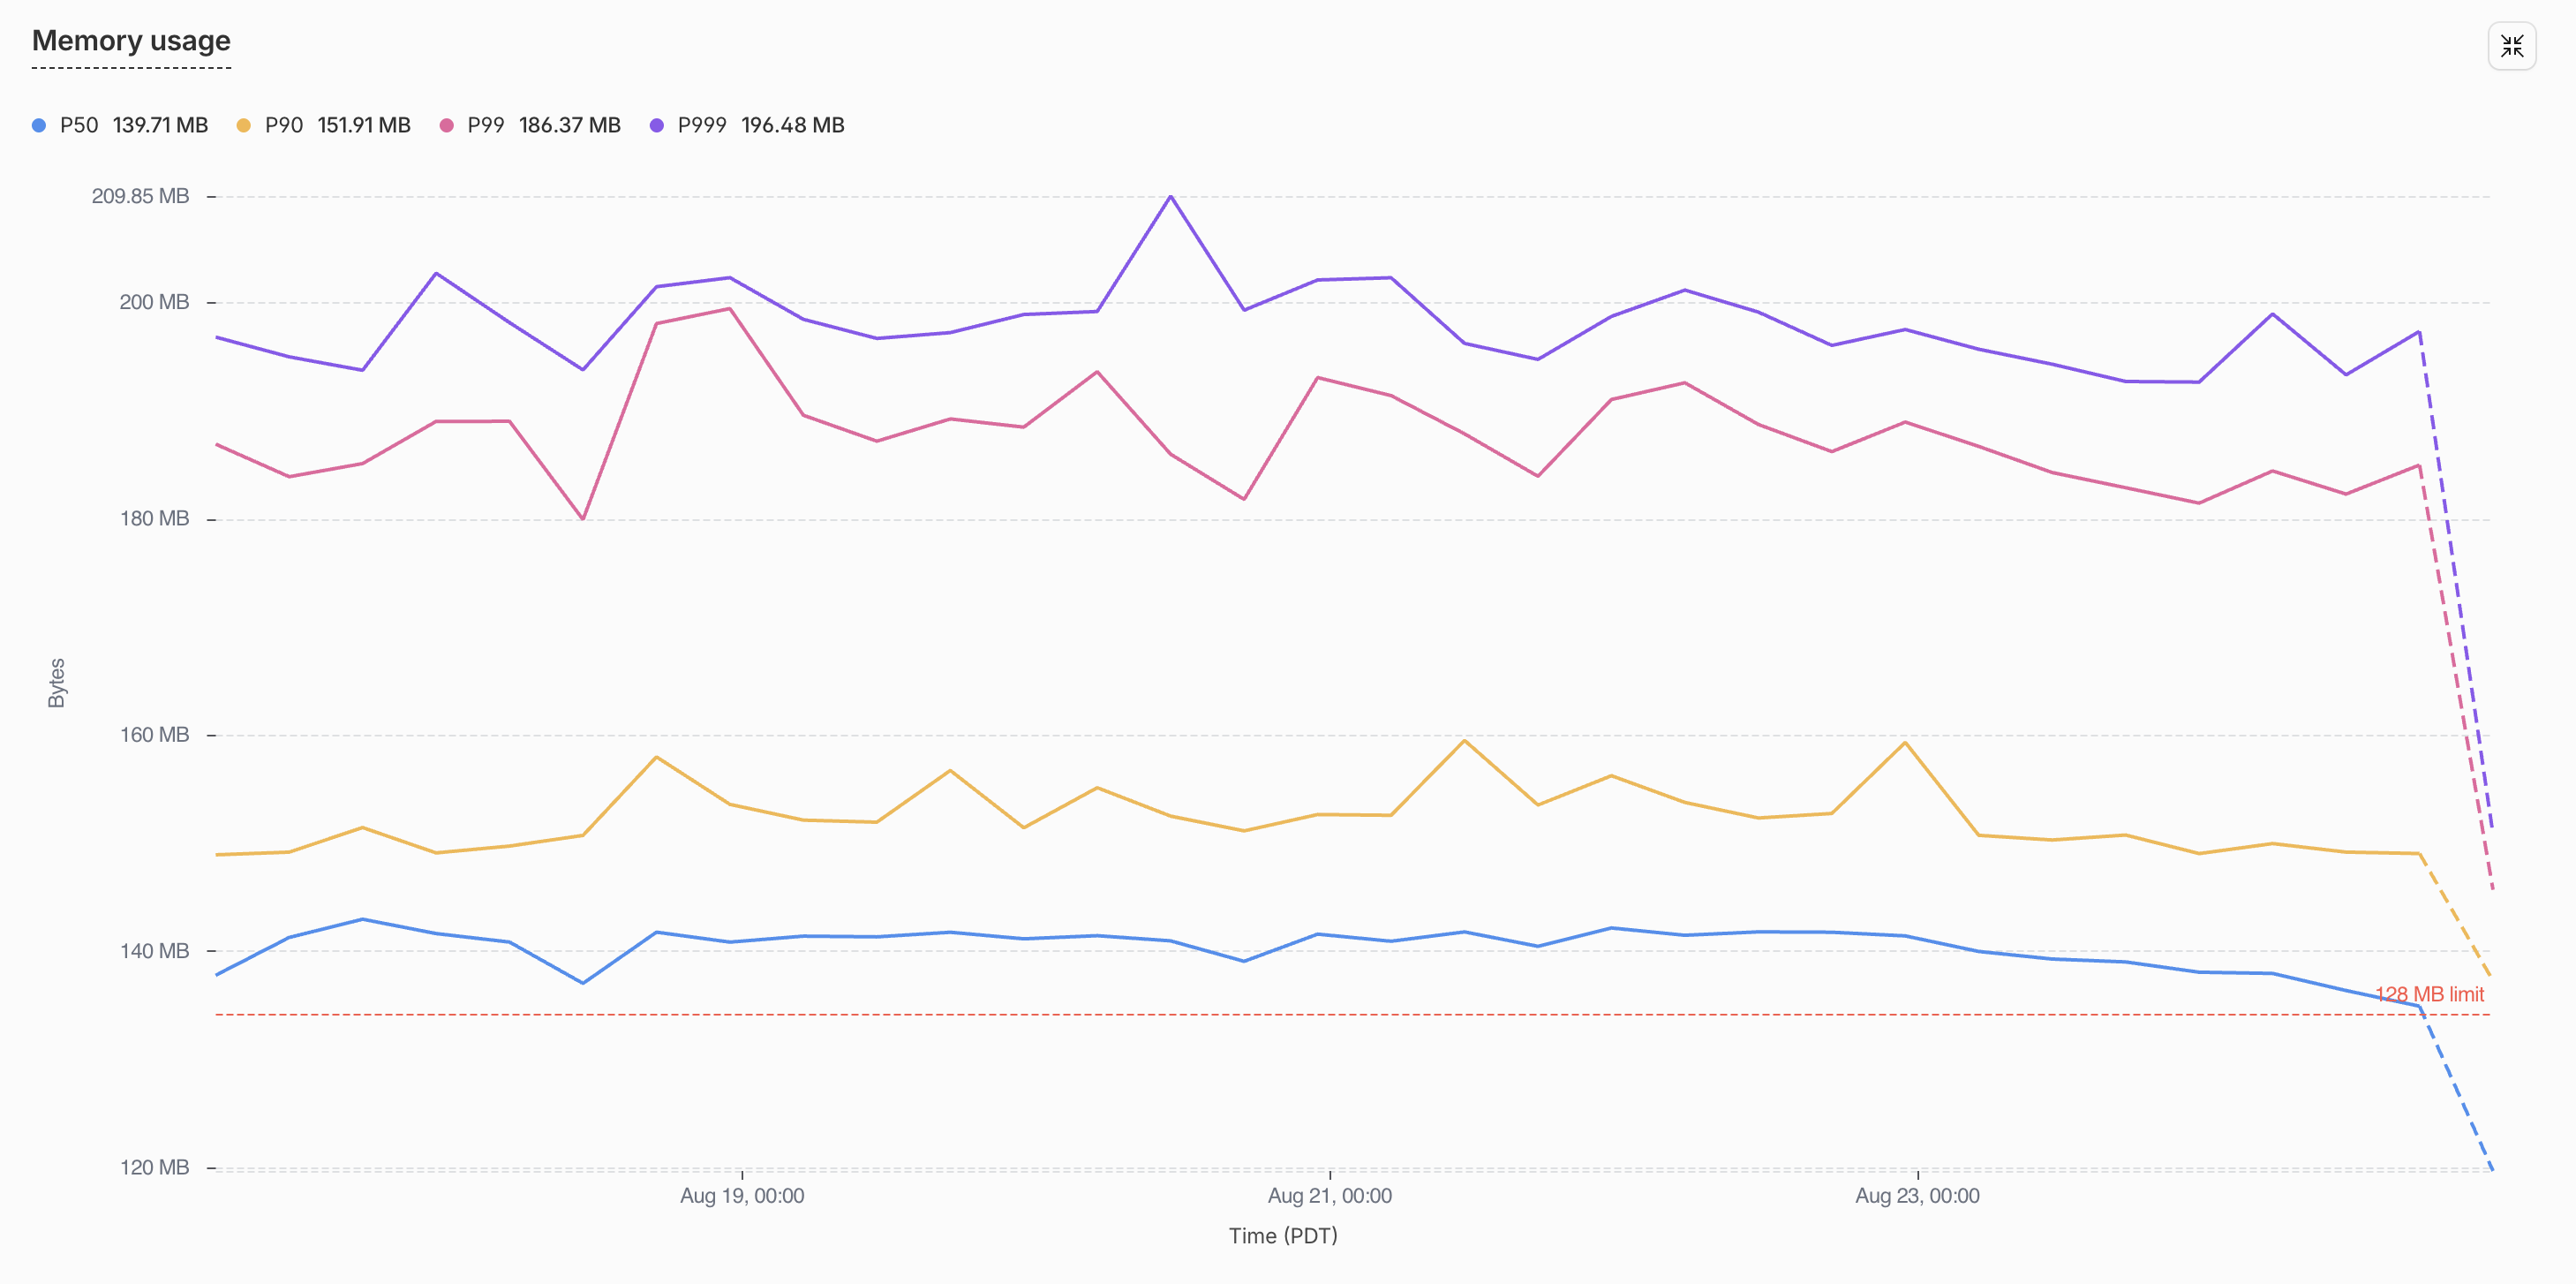
isolate มัธยฐาน เส้นสีน้ำเงินในภาพที่ 1 อยู่ที่ราว 140 MB ตลอดทั้งสัปดาห์ และเปอร์เซ็นไทล์ที่ 99 อยู่ใกล้ 190 MB ทั้งสองเส้นอยู่เหนือเส้นประขีดจำกัด 128 MB ซึ่งหมายความว่า isolate ทั่วไปใน namespace ผ่านจุดที่ Cloudflare มีสิทธิ์รีเซ็ตมันไปแล้ว และรอดมาได้เพียงจนกว่าการจัดสรรครั้งถัดไปจะดันมันข้ามไป สิ่งที่กราฟไม่ได้แสดงคือความสัมพันธ์ใดกับทราฟฟิก เส้นแบนราบในช่วงเงียบเท่ากับช่วงยุ่ง และไม่มีการรีเซ็ตใดในราว 300 ครั้งต่อวันมาพร้อม stack trace เพราะไม่เคยเป็นโค้ดของเราที่ throw
เราดูในที่ที่คุณจะคาดว่าควรดูก่อน เราอ่านขนาด payload เราตรวจว่าประวัติแชทถูกตัดอย่างไร และเราค้นเส้นโค้งหน่วยความจำหารูปแบบของคำขอ และไม่พบอะไรที่ขยับเส้นนั้น ความแบนราบนั้นกลายเป็นเบาะแสสำคัญ หน่วยความจำของ isolate เป็นหนึ่งในสองสิ่ง: มันคือ ข้อมูล หมายถึง payload ของคำขอ ประวัติแชท เอาต์พุตของเครื่องมือ และอะไรก็ตามที่จัดสรรขณะให้บริการทราฟฟิก หรือมันคือ baseline หมายถึง object ที่โค้ดเองสร้างเมื่อโมดูลโหลดและคงไว้ตลอดอายุของ isolate เช่น import ฟังก์ชัน และสคีมา ข้อมูลขึ้นลงตามคำขอ ส่วน baseline อยู่ตรงนั้นก่อนคำขอแรกและไม่มีวันหายไป กราฟที่สูงและแบนราบขณะว่างจึงกำลังบรรยาย baseline ปัญหาต้องอยู่ในสิ่งที่เราปล่อยออกไป ไม่ใช่ในสิ่งที่เราให้บริการ
![graph TB
H["Isolate heap"] --> B["Baseline: built at module load"]
H --> D["Data: allocated per request"]
B --> B1["imports"]
B --> B2["tool schemas"]
B --> B3["package barrels"]
D --> D1["payloads"]
D --> D2["chat history"]
D --> D3["tool outputs"]
style B fill:#fee2e2,stroke:#fca5a5,color:#7f1d1d](/diagrams/bf60aa6a.svg)
ทำไมหน่วยความจำ baseline จึงมองข้ามได้ง่ายนัก
หน่วยความจำ baseline ซ่อนอยู่ในสองที่ที่คุณปกติไม่มอง
ที่แรกคือ bundler เราถือว่า tree shaking ลบโค้ดที่เราไม่ใช้ และส่วนใหญ่มันก็ทำ แต่ esbuild มีกฎว่าเมื่อใดตัดได้ และไม่ใช่กฎที่คุณจะเดาถูก แพ็กเกจที่ไม่มี "sideEffects": false ใน package.json จะไม่ถูกตัดเลย export * ภายในโมดูลที่ประเมินแบบ lazy ก็ไม่ถูกตัดเช่นกัน import() แบบไดนามิกของรากแพ็กเกจทำเครื่องหมายว่าทุก export ถูกใช้ เราจะกลับมาที่แต่ละข้อในส่วนการแก้ไข เพราะพวกมันอธิบายครึ่งหนึ่งของ 130 MB
// Three ways to keep every zod schema in a package alive in the isolate,
// none of which look like a mistake.

// The package has no "sideEffects": false, so nothing in it is pruned.
import { getWorkspaceStub } from "@scope/durable-workspaces";

// Inside a lazily evaluated module, export * is never pruned.
export * from "./zod";

// A namespace object marks every export as used, schemas included.
const pkg = await import("@scope/durable-workspaces");
ที่สองคือไลบรารีสคีมา type รู้สึกเหมือนฟรีเพราะมันหายไปตอน compile แต่สคีมา zod ไม่ใช่ type มันคือต้นไม้ของ closure ที่ถูกสร้างทันทีที่โมดูลของมันถูกประเมิน สคีมา object ของ zod 4 ขนาดกลางหนึ่งตัว สิบสองฟิลด์พร้อม description และ refinement มีต้นทุน heap ~134 KB z.string() เปล่า ๆ มีต้นทุน ~12 KB object JSON schema ธรรมดาที่เทียบเท่ามีต้นทุนไม่กี่ร้อยไบต์ ไม่มีข้อไหนอยู่ใน README
// What each of these costs the moment its module evaluates.
const Params = z.object({                     // ~134 KB for a dozen fields like these
  owner: z.string().describe("Repository owner"),
  repo: z.string().describe("Repository name"),
  pullNumber: z.number().int().describe("PR number"),
});
const Name = z.string();                      // ~12 KB

const params = {                              // a few hundred bytes
  type: "object",
  properties: { owner: { type: "string" }, repo: { type: "string" } },
} as const;
เราไม่ได้ทำอะไรแปลกเลย
ทุกปัญหาของเรามาจากค่าเริ่มต้น ทุกเครื่องมือของเอเจนต์ประกาศอินพุตด้วย z.object() ที่ระดับโมดูล เพราะเอกสารทำแบบนั้น ทุกแพ็กเกจภายในมี barrel index.ts พร้อม export * from "./zod" เพราะมันเรียบร้อย ไม่กี่พาธใช้ await import("@scope/package") เพราะการโหลดแบบ lazy ควรจะถูกกว่า แต่ละข้อเป็นทางเลือกที่สมเหตุสมผลในตัวเอง รวมกันแล้วมันคือ 130 MB ใน isolate ที่มีให้ใช้ 128
// packages/tools/src/github/get-pull-request.ts, and 250 more like it
export const parameters = z.object({
  owner: z.string().describe("Repository owner"),
  repo: z.string().describe("Repository name"),
  pullNumber: z.number().int().describe("PR number"),
});

// packages/thread-core/src/index.ts, and every other internal package
export * from "./zod";
export * from "./thread";

// packages/durable-threads/src/agent.ts
const { getWorkspaceStub } = await import("@scope/durable-workspaces");
มันทำให้เราเสียอะไรไป
เอเจนต์ของเรามีเครื่องมือกว่า 250 ตัว ซึ่งมันใช้ผ่าน code mode และ dynamic worker นิยาม zod ของพวกมันอย่างเดียวมีต้นทุน heap 78 MB ตอนโหลดโมดูล มากกว่าครึ่งหนึ่งของงบประมาณของ isolate หมดไปกับคำอธิบายของอาร์กิวเมนต์ก่อนที่ตัวใดจะถูกเรียก ทุกเครื่องมือที่เราเพิ่มมีต้นทุนอีก ~134 KB ไม่ว่าเครื่องมือนั้นจะเคยรันหรือไม่
250+ tools × ~134 KB of zod each   ≈  78 MB   evaluated before the first request
128 MB isolate cap − 78 MB         =  50 MB   left for every thread's actual data
การรีเซ็ตก็ไม่ฟรีเช่นกัน ทุก exceededMemory โยนเทิร์นของเอเจนต์ที่กำลังดำเนินอยู่ทิ้ง: การ retry การเรียกโมเดลครั้งที่สอง ผู้ใช้ที่จ้อง spinner ที่ ~300 ครั้งต่อวัน มันเลิกเป็น incident และกลายเป็นภาษีถาวร และเพราะการอยู่ร่วมกัน มันถูกจ่ายโดย object ตัวใดก็ตามที่บังเอิญอยู่ใน isolate ในเวลานั้น
Error: Durable Object's isolate exceeded its memory limit and was reset.เราหามันเจอได้อย่างไร: heap profiler สำหรับ bundle ของ production
เราโปรไฟล์ production ไม่ได้ เราจึงสร้าง profiler ขนาดเล็กที่รันในเครื่องบน bundle ตัวเดียวกับที่ production รันจริง มันวัดต้นทุน heap ของ V8 ในการประเมินทุกโมดูลและพิมพ์ตารางเรียงอันดับ เรารันมันเป็นวงจร: โปรไฟล์ ลบอันดับต้นออก โปรไฟล์อีกครั้ง การตรวจสอบสุดท้ายของทุกการแก้ไขคือ deploy ขึ้น production แล้วเทียบกับ metric หน่วยความจำของ Cloudflare สองฝั่งของเครื่องหมาย deploy
![graph TB
A["wrangler deploy --dry-run"] --> B["production bundle + metafile"]
B --> C["instrument the __esm helper"]
C --> D["run under Node with stubs"]
D --> E["exclusive heap per module"]
style E fill:#d1fae5,stroke:#6ee7b7,color:#065f46](/diagrams/0b647474.svg)
สามไอเดียที่ทำให้มันได้ผล:
- bundle เดียวกัน
wrangler deploy --dry-run --outdir --metafileส่งออก bundle ของ esbuild ตัวเดียวกับที่การ deploy จะอัปโหลด บวกกราฟโมดูลของมัน ทุกอย่างวัดบน bundle นั้น - การระบุที่มาระดับโมดูล esbuild ห่อโมดูลที่ประเมินแบบ lazy ไว้ใน closure ตัวเริ่มต้น
__esm(...)เราเขียน helper ตัวเดียวนั้นใน bundle ที่สร้างแล้วใหม่ เพื่อให้ทุกการเริ่มต้นโมดูลบันทึกv8.getHeapStatistics().used_heap_sizeก่อนและหลังตัวเอง พร้อม init stack ที่แยกต้นทุนของโมดูลเอง (exclusive) ออกจากของ dependency ของมัน (inclusive) ผลลัพธ์คือชุดข้อมูลรูปร่างเหมือน flamegraph - การรันแบบควบคุม bundle ที่ติดตั้งเครื่องมือวัดแล้วรันภายใต้ Node ธรรมดาพร้อม loader shim ที่ resolve import ของ
cloudflare:*ไปยัง stub
สูตรฉบับสมบูรณ์ พร้อมวางลงในเอเจนต์เขียนโค้ด อยู่ท้ายโพสต์นี้ ต้นทุนต่อหน่วยของ zod ที่อ้างข้างบนมาจาก micro-benchmark ที่รันผ่าน harness เดียวกัน
โปรไฟล์แรกแสดงอะไร
| แหล่งที่มา | heap แบบ exclusive |
|---|---|
packages/tools (นิยามเครื่องมือของเอเจนต์กว่า 250 ตัว, zod) | 78.0 MB |
| barrel ของแพ็กเกจที่ re-export โมดูลสคีมา zod (แถวด้านล่าง) | ~66 MB |
durable-workspaces (สถานะและกำหนดการของ workspace) | 15.6 MB |
thread-core (ชั้นข้อมูลของเธรด) | 10.1 MB |
durable-automations (นิยาม automation) | 9.6 MB |
durable-threads (รายการเธรดและการอัปเดตสด) | 7.3 MB |
durable-automation (การรัน automation หนึ่งครั้ง) | 6.8 MB |
db (client และโมเดลของ D1) | 6.3 MB |
durable-skills (นิยาม skill) | 5.7 MB |
durable-autofixes (branch และการ merge ของ autofix) | 4.9 MB |
| แพ็กเกจเล็กอีก 12 ตัว | ~9 MB |
แถวที่สองคือแถวที่น่าประหลาดใจ นั่นคือสคีมาที่เข้าถึง bundle ได้ผ่าน export * from "./zod" ใน barrel ของแพ็กเกจเท่านั้น โค้ดของเราไม่เคยใช้พวกมัน tree shaker ลบไม่ได้ และพวกมันมีต้นทุนหนึ่งในสามของขีดจำกัดหน่วยความจำ ทั้งหมดอยู่ในโมดูลที่ไม่มีอะไรเคยเรียก
การแก้ไข A: นิยามเครื่องมือเป็นข้อมูล ไม่ใช่โค้ด
ทุกนิยามเครื่องมือประกาศสคีมาอินพุตด้วย zod และแปลงเป็น JSON schema ขณะรัน เพราะ JSON schema คือสิ่งที่ถูกส่งให้โมเดลอยู่แล้ว เรากำลังสร้าง closure ~134 KB ต่อเครื่องมือเพื่อผลิตข้อมูลไม่กี่ร้อยไบต์ เราจึงเขียนข้อมูลนั้นโดยตรง
![graph TB
Z["zod schema, ~134 KB per tool"] --> J["toJSONSchema() at runtime"]
J --> M["JSON schema sent to the model"]
D["JSON schema, ~0.3 KB per tool"] --> M
style Z fill:#fee2e2,stroke:#fca5a5,color:#7f1d1d
style D fill:#d1fae5,stroke:#6ee7b7,color:#065f46](/diagrams/5f84b543.svg)
// before: ~134 KB of closures per tool, built at module load
export const parameters = z.object({
  owner: z.string().describe("Repository owner"),
  repo: z.string().describe("Repository name"),
  pullNumber: z.number().int().describe("PR number"),
});

// after: a few hundred bytes of data, and the type comes from the schema
export const parameters = defineParameters({
  type: "object",
  properties: {
    owner: { type: "string", description: "Repository owner" },
    repo: { type: "string", description: "Repository name" },
    pullNumber: { type: "number", description: "PR number" },
  },
  required: ["owner", "repo", "pullNumber"],
} as const);
export type Input = ParametersInput<typeof parameters>;
defineParameters คือ wrapper บาง ๆ เหนือ jsonSchema() ของ AI SDK ParametersInput คือ json-schema-to-ts ที่ทำการอนุมาน type แบบที่ zod เคยทำ การตรวจสอบขณะรันย้ายไปอยู่ใน validator ~300 บรรทัดที่ทำซ้ำคุณสมบัติที่ลูปของเอเจนต์พึ่งพา: ตัด key ที่ไม่รู้จัก เติมค่าเริ่มต้น resolve union ด้วย discriminator และข้อความ error ที่เขียนให้โมเดลซ่อมการเรียกเครื่องมือของตัวเองได้เมื่อ retry
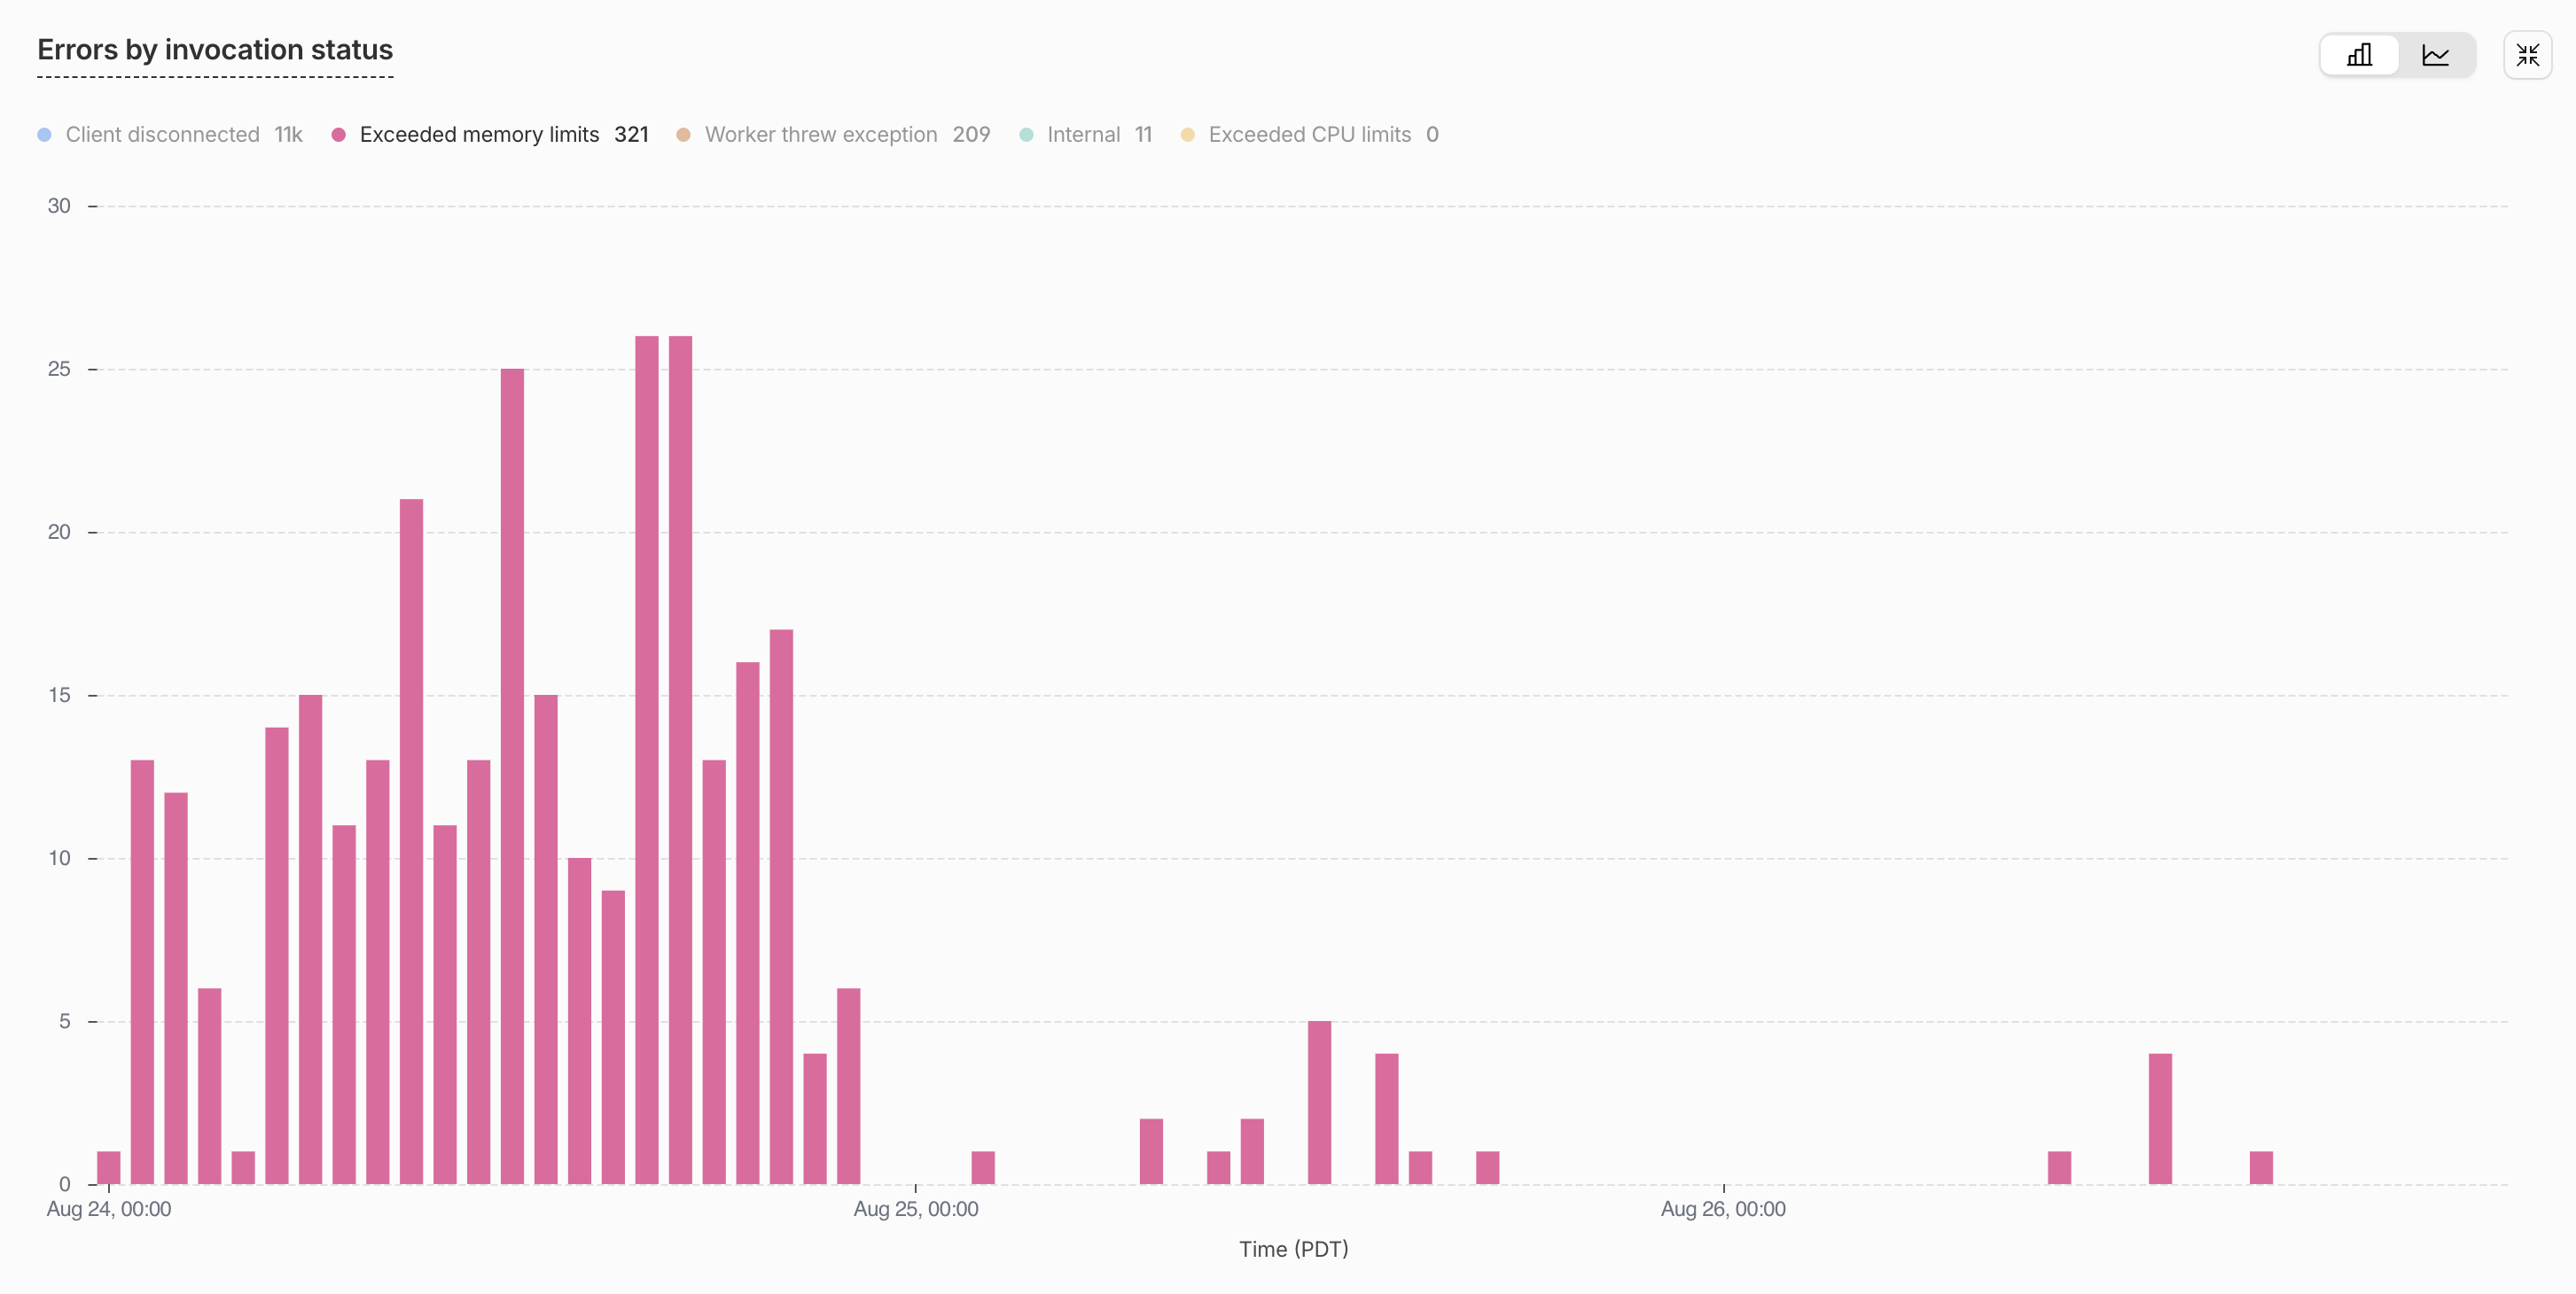
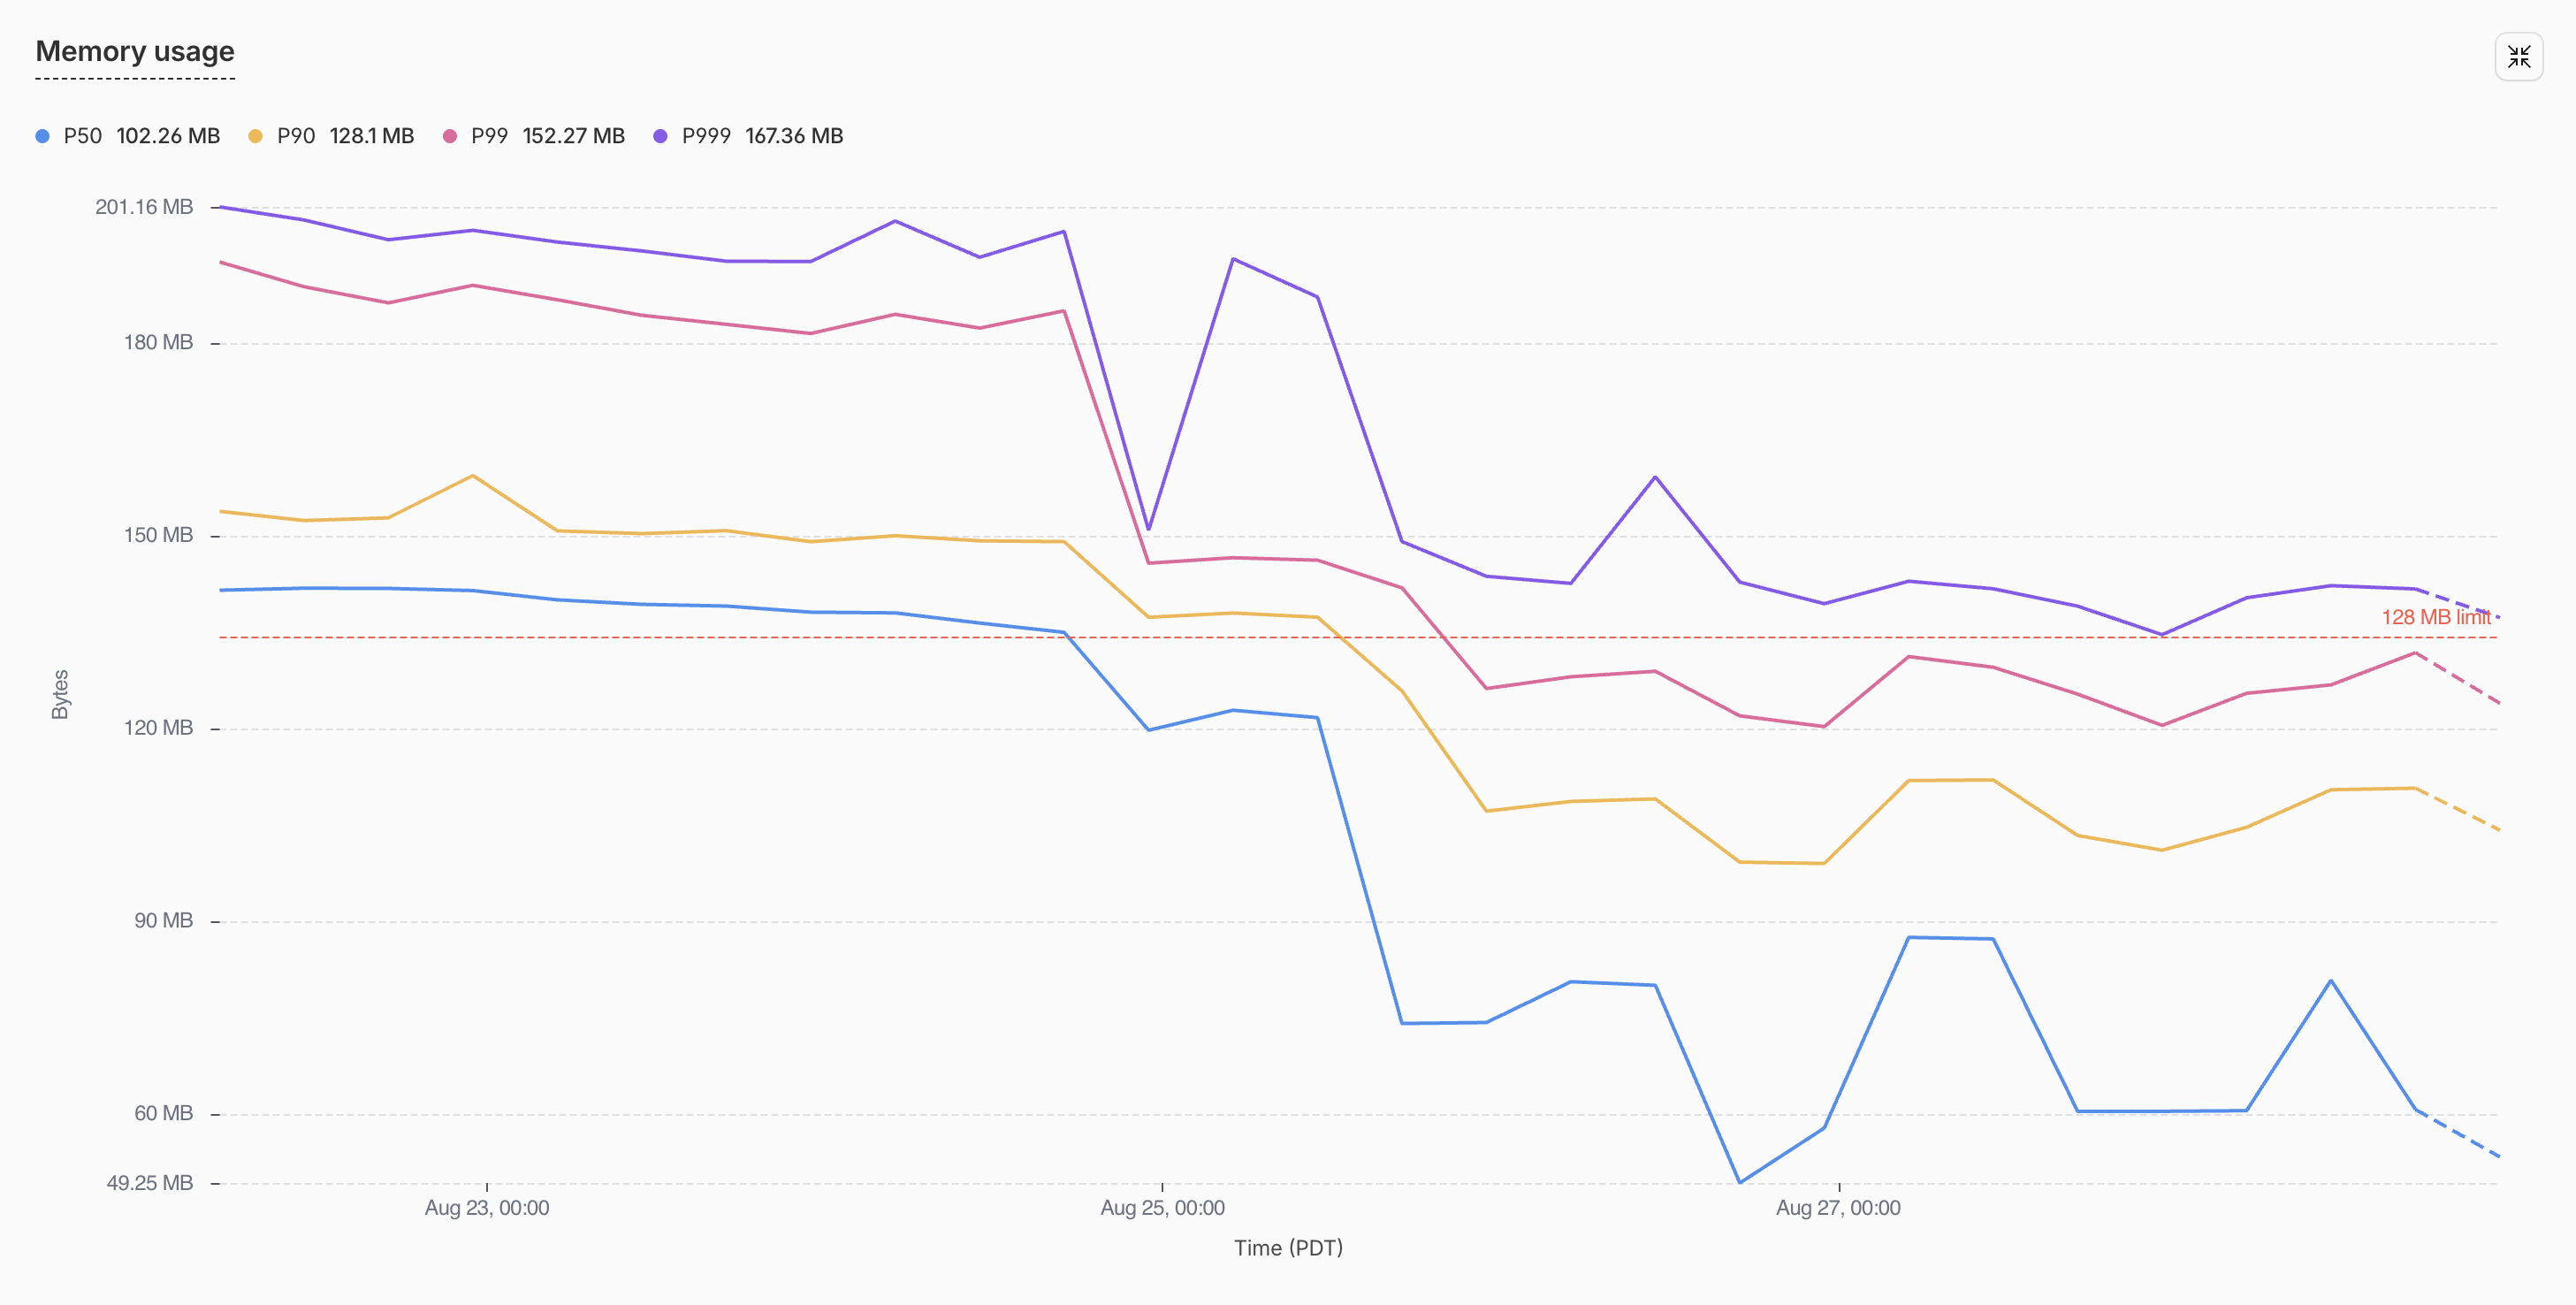
heap จากการประเมินโมดูลลงจาก 218.6 เป็น 154.0 MB ในเครื่อง และ packages/tools จาก 78 MB เหลือ 0.7 MB ใน production การรีเซ็ตลดจาก 40-110 ต่อชั่วโมงเหลือ 0-6 ต่อชั่วโมงที่เครื่องหมาย deploy และหน่วยความจำของ isolate มัธยฐานจาก ~140 MB เหลือ ~120 MB
การแก้ไข B: barrel ที่ tree-shake ได้จริง
~66 MB ที่เหลือคือสคีมาที่ isolate ไม่เคยใช้ พฤติกรรมของ bundler สามข้ออธิบายมัน:
- หากไม่มี
"sideEffects": falseในpackage.jsonของแพ็กเกจ esbuild ไม่ตัดอะไรจากแพ็กเกจนั้นเลย - แม้มีแฟล็กนี้
export * from "./zod"ก็ไม่ถูกตัดภายในโมดูลที่ประเมินแบบ lazy และอะไรก็ตามที่เข้าถึงได้ผ่านimport()แบบไดนามิกจะถูกประเมินแบบ lazy re-export แบบระบุชื่อ (export { zFoo } from "./zod") ถูกตัดได้ตามปกติ await import("@scope/package")สร้าง namespace object ทั้งหมดของแพ็กเกจขึ้นมาจริง ทำเครื่องหมายว่าทุก export ถูกใช้: สคีมา class ทุกอย่าง
เรายืนยันแต่ละข้อด้วย fixture ห้าไฟล์ที่สร้างด้วย esbuild เวอร์ชันที่ wrangler ฝังไว้: entry หนึ่งไฟล์ แพ็กเกจที่มี barrel index.ts ไฟล์ zod.ts ที่ถือสคีมาหนึ่งตัวซึ่ง constructor ประกาศเมื่อมันรัน class ใน do.ts ที่ import สคีมานั้น และตัวกลางแบบ lazy ระหว่างพวกมัน ตารางบันทึกว่า constructor ของสคีมารันตอนประเมินหรือไม่สำหรับแต่ละชุดค่าผสม
| entry import barrel ผ่าน | รูปแบบ re-export ของ barrel | sideEffects: false | รวมสคีมา |
|---|---|---|---|
| import แบบ static | export * | ใช่ | ไม่ |
| import แบบ static | export * | ไม่ | ใช่ |
import() แบบไดนามิกของแพ็กเกจ | แบบใดก็ได้ | ใช่ | ใช่ |
| import แบบ static จากโมดูลที่โหลดแบบ lazy | export * | ใช่ | ใช่ |
| import แบบ static จากโมดูลที่โหลดแบบ lazy | รายการระบุชื่อ | ใช่ | ไม่ |
| แบบใดก็ได้ | รายการระบุชื่อ | ไม่ | ใช่ |
แถวที่ 3 และ 4 คือสองแถวที่ทำให้คนประหลาดใจ และรวมกันแล้วคิดเป็น ~66 MB นี่คือสิ่งที่ barrel หนึ่งตัวทำกับเรา:
![graph TB
A["do.ts imports one function"] --> B["durable-workspaces barrel"]
B -->|"export * from './zod'"| C["zod/*.ts, 15.6 MB of schemas"]
B -->|"used"| D["getWorkspaceStub(), ~1 KB"]
style C fill:#fee2e2,stroke:#fca5a5,color:#7f1d1d
style D fill:#d1fae5,stroke:#6ee7b7,color:#065f46](/diagrams/5d71e80c.svg)
การแก้ไขเป็นงานเชิงกล: "sideEffects": false ในแพ็กเกจ workspace กว่า 110 ตัวทั้งหมด เขียน export * ของ barrel ใหม่เป็นรายการ re-export แบบระบุชื่อ และแทน await import("@scope/package") ของรากแพ็กเกจด้วย import แบบ static ที่ระบุชื่อ
การทดลองตัดทีละส่วนบน bundle ของ production จริงแสดงว่าแต่ละส่วนจำเป็น
| การตั้งค่า | heap หลังการประเมินโมดูล | โมดูลสคีมาใน bundle |
|---|---|---|
| baseline (หลังการแก้ไข A) | 154.0 MB | 77 |
sideEffects: false อย่างเดียว | 143.6 MB | 77 |
+ import แบบ static, barrel กลับไปเป็น export * (กลุ่มควบคุม) | 98.6 MB | 29 |
| + รายการ re-export แบบระบุชื่อ (การแก้ไขครบ) | 82.1 MB | 0 |
แถวกลุ่มควบคุมคือแถวที่น่าสนใจ: แม้กราฟ import จะเป็น static ทั้งหมด ก็ยังเหลือโมดูลสคีมา 29 ตัว รายการระบุชื่อจึงไม่ใช่ตัวเลือกเสริม
สภาวะสุดท้าย
| heap ระดับโมดูล (ตัววัดในเครื่อง) | หน่วยความจำมัธยฐานใน production | การรีเซ็ตใน production | |
|---|---|---|---|
| ก่อน | 218.6 MB | ~140 MB | ~300/วัน |
| หลัง A | 154.0 MB | ~120 MB | ~10/วัน |
| หลัง A+B | 82.1 MB | ~70 MB | 0 |
Durable Object ที่เคยอยู่เหนือขีดจำกัดหน่วยความจำของแพลตฟอร์มขณะว่าง ตอนนี้อยู่ที่แค่ครึ่งเดียวของมันขณะว่าง และการรีเซ็ต ~300 ครั้งต่อวันหายไป
นี่ไม่ใช่แฟล็กในการตั้งค่า
การเขียนนิยามเครื่องมือกว่า 250 ตัวใหม่จาก zod เป็น JSON schema ดิบ และเขียน validator 300 บรรทัดเพื่อแทนสิ่งที่ zod ทำให้เรา ใช้เวลาไม่กี่วัน แม้มีเอเจนต์เขียนโค้ดช่วย การเพิ่ม sideEffects: false ให้แพ็กเกจกว่า 100 ตัวและเปลี่ยนทุก export * เป็นรายการระบุชื่อที่สร้างขึ้นเป็นงานที่ไม่เร้าใจ และคุณ typecheck ทั้ง repo หลังจากนั้นแล้วแก้สิ่งที่พัง ทางเลือกง่าย ๆ คือเพิ่ม retry แล้วอยู่กับการรีเซ็ต และหลายทีมก็ทำแบบนั้น ถ้า Durable Object ของคุณอยู่ใกล้ขีดจำกัดขณะว่างแม้แต่นิดเดียว ผมขอเถียงว่าสัปดาห์นั้นคุ้มค่า เพราะขีดจำกัดไม่ขยับ และจำนวนเครื่องมือของคุณมีแต่จะเพิ่ม
สามสิ่งที่ผมอยากรู้ตั้งแต่วันแรก:
- สูงและแบนราบขณะว่างหมายถึง baseline โปรไฟล์สิ่งที่คุณปล่อยออกไป ไม่ใช่สิ่งที่คุณให้บริการ
- tree shaking มีกฎ
sideEffects: false, re-export แบบระบุชื่อ, import แบบ static พลาดข้อเดียว ทั้งแพ็กเกจก็ติดไปด้วย - สคีมาคือโค้ด ไม่ใช่ type ถ้าผู้บริโภคต้องการ JSON schema ก็เขียน JSON schema
ทำสิ่งนี้วันนี้เพื่อแก้หน่วยความจำของ Durable Object ของคุณ
profiler มี ~100 บรรทัด ไม่มี dependency นอกจาก Node และ wrangler วางสูตรด้านล่างลงในเอเจนต์เขียนโค้ดของคุณที่รากของ repo ใดก็ได้ที่ deploy ด้วย wrangler อ่านสิบแถวบนสุดของตารางที่มันพิมพ์ แล้วดูว่ามีอะไรอยู่ จากนั้นไล่ลงตามรายการ: JSON schema ธรรมดาสำหรับอะไรก็ตามที่โมเดลได้รับเป็น JSON schema อยู่แล้ว "sideEffects": false และ re-export แบบระบุชื่อสำหรับ barrel และ import แบบ static สำหรับรากแพ็กเกจ
Build a per-module heap profiler for my worker's production bundle.

1. Emit the exact production bundle and metafile:

   cd <worker-dir>
   npx wrangler deploy --dry-run --env <stage> --config wrangler.jsonc \
     --outdir /tmp/heap-probe --metafile /tmp/heap-probe/meta.json

   If the worker's import graph is fully static, esbuild emits no lazy
   `__esm` wrappers and per-module attribution is impossible. In that case
   build from a probe-only entry that reaches the real entry through a
   dynamic import (and satisfies wrangler's Durable Object export check
   with a placeholder class):

   // probe-entry.ts
   export default { fetch: () => new Response("probe") };
   export class <YourDurableObjectClassName> {}
   export const probeLoad = () => import("<path-to-real-entry>");

   npx wrangler deploy --dry-run --env <stage> --config wrangler.jsonc \
     --outdir /tmp/heap-probe --metafile /tmp/heap-probe/meta.json probe-entry.ts

2. Instrument the bundle. Write instrument.mjs and run
   `node instrument.mjs /tmp/heap-probe`:

   import { readFileSync, writeFileSync } from "node:fs";
   import { join } from "node:path";

   const outDir = process.argv[2];
   const bundlePath = join(outDir, "probe-entry.js"); // or index.js
   const source = readFileSync(bundlePath, "utf-8");

   const esmHelperPattern = /var __esm = \(fn, res(?:, \w+)?\) => function __init\(\) \{[\s\S]*?\n\};\n/;
   if (!esmHelperPattern.test(source)) throw new Error("__esm helper not found; esbuild output shape changed");

   const instrumentedHelper = `var __probeInitStack = [];
   var __esm = (fn, res, err2) => function __init() {
     if (err2) throw err2[0];
     if (!fn) return res;
     const probe = globalThis.__moduleHeapProbe;
     if (!probe) {
       try { return (res = (0, fn[__getOwnPropNames(fn)[0]])(fn = 0)), res; }
       catch (e) { throw ((err2 = [e]), e); }
     }
     const moduleName = __getOwnPropNames(fn)[0];
     const frame = { child: 0 };
     const before = probe.heap();
     __probeInitStack.push(frame);
     try { return (res = (0, fn[moduleName])(fn = 0)), res; }
     catch (e) { throw ((err2 = [e]), e); }
     finally {
       const total = probe.heap() - before;
       __probeInitStack.pop();
       if (__probeInitStack.length > 0) __probeInitStack[__probeInitStack.length - 1].child += total;
       probe.record(moduleName, total - frame.child, total);
     }
   };
   `;
   writeFileSync(join(outDir, "instrumented.mjs"), source.replace(esmHelperPattern, instrumentedHelper));

3. Write a Node loader shim so worker-targeted code loads under Node.
   register.mjs resolves `cloudflare:*` to a stub module (an empty module
   exporting throwing placeholders for DurableObject, WorkerEntrypoint,
   env, etc.) via module.registerHooks; add a `load` hook for any
   non-JS rules in your wrangler config (for us: `.sql` files become
   text default exports, mirroring wrangler's Text rule).

4. Write probe.mjs and run it:

   node --expose-gc --import ./register.mjs probe.mjs /tmp/heap-probe

   import { join } from "node:path";
   import { pathToFileURL } from "node:url";
   import v8 from "node:v8";

   const outDir = process.argv[2];
   const records = [];
   globalThis.__moduleHeapProbe = {
     heap: () => v8.getHeapStatistics().used_heap_size,
     record: (moduleName, exclusive, total) => records.push({ moduleName, exclusive, total }),
   };
   const settle = async () => { await new Promise((r) => setTimeout(r, 0)); globalThis.gc(); globalThis.gc(); };
   const mb = (b) => (b / 1048576).toFixed(2);

   await settle();
   const bundle = await import(pathToFileURL(join(outDir, "instrumented.mjs")).href);
   if (bundle.probeLoad) await bundle.probeLoad();
   await settle();
   console.log(`heap after module evaluation: ${mb(v8.getHeapStatistics().used_heap_size)} MB`);

   for (const r of records.sort((a, b) => b.exclusive - a.exclusive).slice(0, 40))
     console.log(`${mb(r.exclusive).padStart(8)} MB  ${r.moduleName}`);

   const byPackage = new Map();
   for (const r of records) {
     const m = r.moduleName.match(/node_modules\/((?:@[^/]+\/)?[^/]+)|(packages\/[^/]+)/);
     const key = m ? (m[1] ? `npm:${m[1]}` : m[2]) : "other";
     byPackage.set(key, (byPackage.get(key) ?? 0) + r.exclusive);
   }
   for (const [k, v] of [...byPackage.entries()].sort((a, b) => b[1] - a[1]))
     if (v > 131072) console.log(`${mb(v).padStart(8)} MB  ${k}`);

5. Gotchas that will otherwise burn an afternoon:
   - The bundle's unenv polyfill replaces globalThis.process at init and its
     memoryUsage() reports zeros. Read v8.getHeapStatistics() instead.
   - Compare deltas between runs of this probe, never absolutes against
     production: Node's heap baseline differs from workerd's.
   - Modules evaluated eagerly at the top level (not wrapped in __esm) are
     invisible to attribution; the probe-entry trick in step 1 fixes that.
ถ้าคุณอยากให้ทำการตรวจสอบทั้งหมดให้ นี่คือ skill สำหรับเอเจนต์เขียนโค้ดของคุณ:
Audit this repo's worker bundles for module-scope schema weight, and fix what you find. Work in this order and show me numbers at every step.

1. Baseline. Using the "profile module-scope heap" recipe, build the
   production bundle of our most memory-sensitive worker and produce the
   per-module and per-package exclusive-heap ranking. Report heap after
   module evaluation.

2. Identify schema weight. From the ranking and the esbuild metafile, list
   every module matching your schema conventions (zod/valibot/etc. modules,
   e.g. packages/*/zod*) that survived into the bundle, with bytes. For each,
   compute one import chain from the entry using the metafile's `imports`
   graph (BFS), so we know *why* it is in the bundle.

3. Classify each surviving schema module:
   a. Actually used at runtime by this worker: leave it, or move the boundary.
   b. Reached through `export *` in a package barrel: candidate for named lists.
   c. Reached through `await import("<package root>")`: candidate for a static
      named import.
   d. Reached because the package lacks `"sideEffects": false`: candidate flag.

4. Apply, in this order, re-profiling after each:
   a. Add `"sideEffects": false` to every internal package that has no
      import-time side effects. Audit first: grep package sources for
      top-level globalThis mutations, addEventListener, polyfill assignment.
      Any true side-effect file gets `"sideEffects": ["./that-file.ts"]`.
   b. Rewrite `export * from "./<schemas>"` in package barrels to explicit
      `export { ... }` / `export type { ... }` lists. Generate the lists with
      the TypeScript compiler API (walk ExportDeclarations recursively,
      classify value vs type), never by regex. Typecheck the repo after.
   c. Replace every value-position `await import("@scope/pkg")` of a bare
      package root with a static named import of the symbols actually used.
      Check the site is not lazy for a *different* reason first (circular
      imports, Node-only test loading, genuine cold-path npm dependency).

5. If tool/LLM definitions build schema-library objects at module scope,
   propose converting them to plain JSON schema with types via
   json-schema-to-ts, and estimate the saving from step 1's ranking before
   doing it.

6. Verify: re-profile (report the delta), typecheck, run the affected
   packages' tests, and dry-run build every worker. Then add a CI assertion
   that reads the metafile of the memory-sensitive worker and fails if any
   schema module survives tree shaking into it, printing the import chain.

7. After deploy, compare the platform memory metrics across the deploy
   marker and report before/after median and 99th percentile memory, and reset
   counts.
เราได้เพิ่ม skill นี้ลงใน Polylane เองด้วย ผู้ใช้ Polylane ทุกคนจึงได้การสืบสวนเชิงลึกเรื่องหน่วยความจำของ Durable Object ของตัวเองตั้งแต่แกะกล่อง โดยไม่ต้องวางอะไรเลย