

我们如何修复Cloudflare Durable Objects的内存超限错误
Explore with AI
Polylane中的每一个智能体线程都运行在自己的Cloudflare Durable Object里,它们全都是同一个类的实例。2026年8月,我们线程的Durable Objects每天因超出内存限制被重置约300次。我们从多个在Cloudflare Durable Objects上运行智能体流程的团队那里听到了同样的故事。
如果你在Durable Object上碰到过exceededMemory,常见的建议是去看你的请求分配了什么:一个过大的负载、一段无限增长的聊天历史、一个从不淘汰的缓存。这些都不适用于我们。隔离区在处理第一个请求之前就已经超限了,所以重量必然在我们交付的代码里,而不是在我们服务的数据里。
这篇文章讲的是堆里到底有什么,我们如何在一个不允许附加性能分析器的平台上找到它,以及把模块作用域内存从218 MB降到82 MB、把重置降到零的两个改动。
一分钟了解Cloudflare Durable Objects
如果你没用过:Durable Object是一个小型、有状态、单线程的服务器,Cloudflare保证它对给定ID是唯一的。在Worker中用该ID调用idFromName(),来自世界任何地方的针对它的每个请求都会落到同一个实例上,它有自己的SQLite数据库、内存状态和定时器。空闲时它休眠,唤醒后从上次停下的地方继续。
在Polylane中,我们为每个线程创建一个Durable Object实例。与智能体的每一次对话,无论是人发起的还是告警发起的,都有自己的Durable Object。对象的SQLite保存线程的消息和工具结果,智能体循环在其中运行,它的工具会调用该线程需要的任何提供商:Datadog、Sentry、Honeycomb、GitHub、Cloudflare等等。线程安静下来时对象休眠,下一条消息到达时它从停下的地方精确继续。
![graph TB
U["New message or alert"] --> W["Worker"]
W -->|"idFromName(threadId)"| DO["One Durable Object per thread"]
DO --> S["SQLite: messages, tool results"]
DO --> L["Agent loop"]
L --> T["Tools"]
T --> P1["Datadog"]
T --> P2["Sentry"]
T --> P3["Honeycomb"]
T --> P4["GitHub, Cloudflare, ..."]
style DO fill:#d1fae5,stroke:#6ee7b7,color:#065f46](/diagrams/efa7281c.svg)
Durable Objects的内存是如何工作的
- **隔离区和128 MB上限。**Durable Objects运行在V8隔离区中,隔离区有一个128 MB的硬性内存限制,所有套餐相同且不可配置。
- 同址部署。一个隔离区承载同一个类的许多Durable Objects,以及它们周围的Worker代码,它们全部共享该隔离区的内存。限制是按隔离区而不是按对象计的。
- **吵闹的邻居。**由于同址部署,隔离区内存耗尽时被重置的对象往往不是用掉内存的那个对象。Cloudflare报告的每一个内存样本都是整个隔离区的,每一次重置也是。
![graph TB
subgraph ISO["One V8 isolate, 128 MB cap"]
M["Module scope, loaded once"]
D1["Instance A"]
D2["Instance B"]
D3["Instance C"]
end
M --- D1
M --- D2
M --- D3
D3 -->|"heap crosses 128 MB"| R["exceededMemory, C is reset"]
style M fill:#fee2e2,stroke:#fca5a5,color:#7f1d1d
style R fill:#fee2e2,stroke:#fca5a5,color:#7f1d1d](/diagrams/79348818.svg)
没有办法给生产环境的Durable Object附加内存分析器:Cloudflare文档中的堆快照工具只针对本地开发会话运行。在Kubernetes里你会打开性能分析并一直附加着直到找到问题。在workerd里,process.memoryUsage()是一个返回零的unenv polyfill,基线内存和CPU数据对内部运行的代码不可见。你能拿到的是Cloudflare的GraphQL分析API:按命名空间的内存百分位和崩溃计数,事后可查。
内存曲线告诉了我们什么
Cloudflare的分析API以十五分钟为桶,把一个Durable Object命名空间的内存报告为运行它的各隔离区之间的百分位,同时给出每个桶内内存超限错误的计数。本文中的每一张图都来自该API,筛选到线程命名空间,并在我们开始发布修复后按部署标记进行对比。
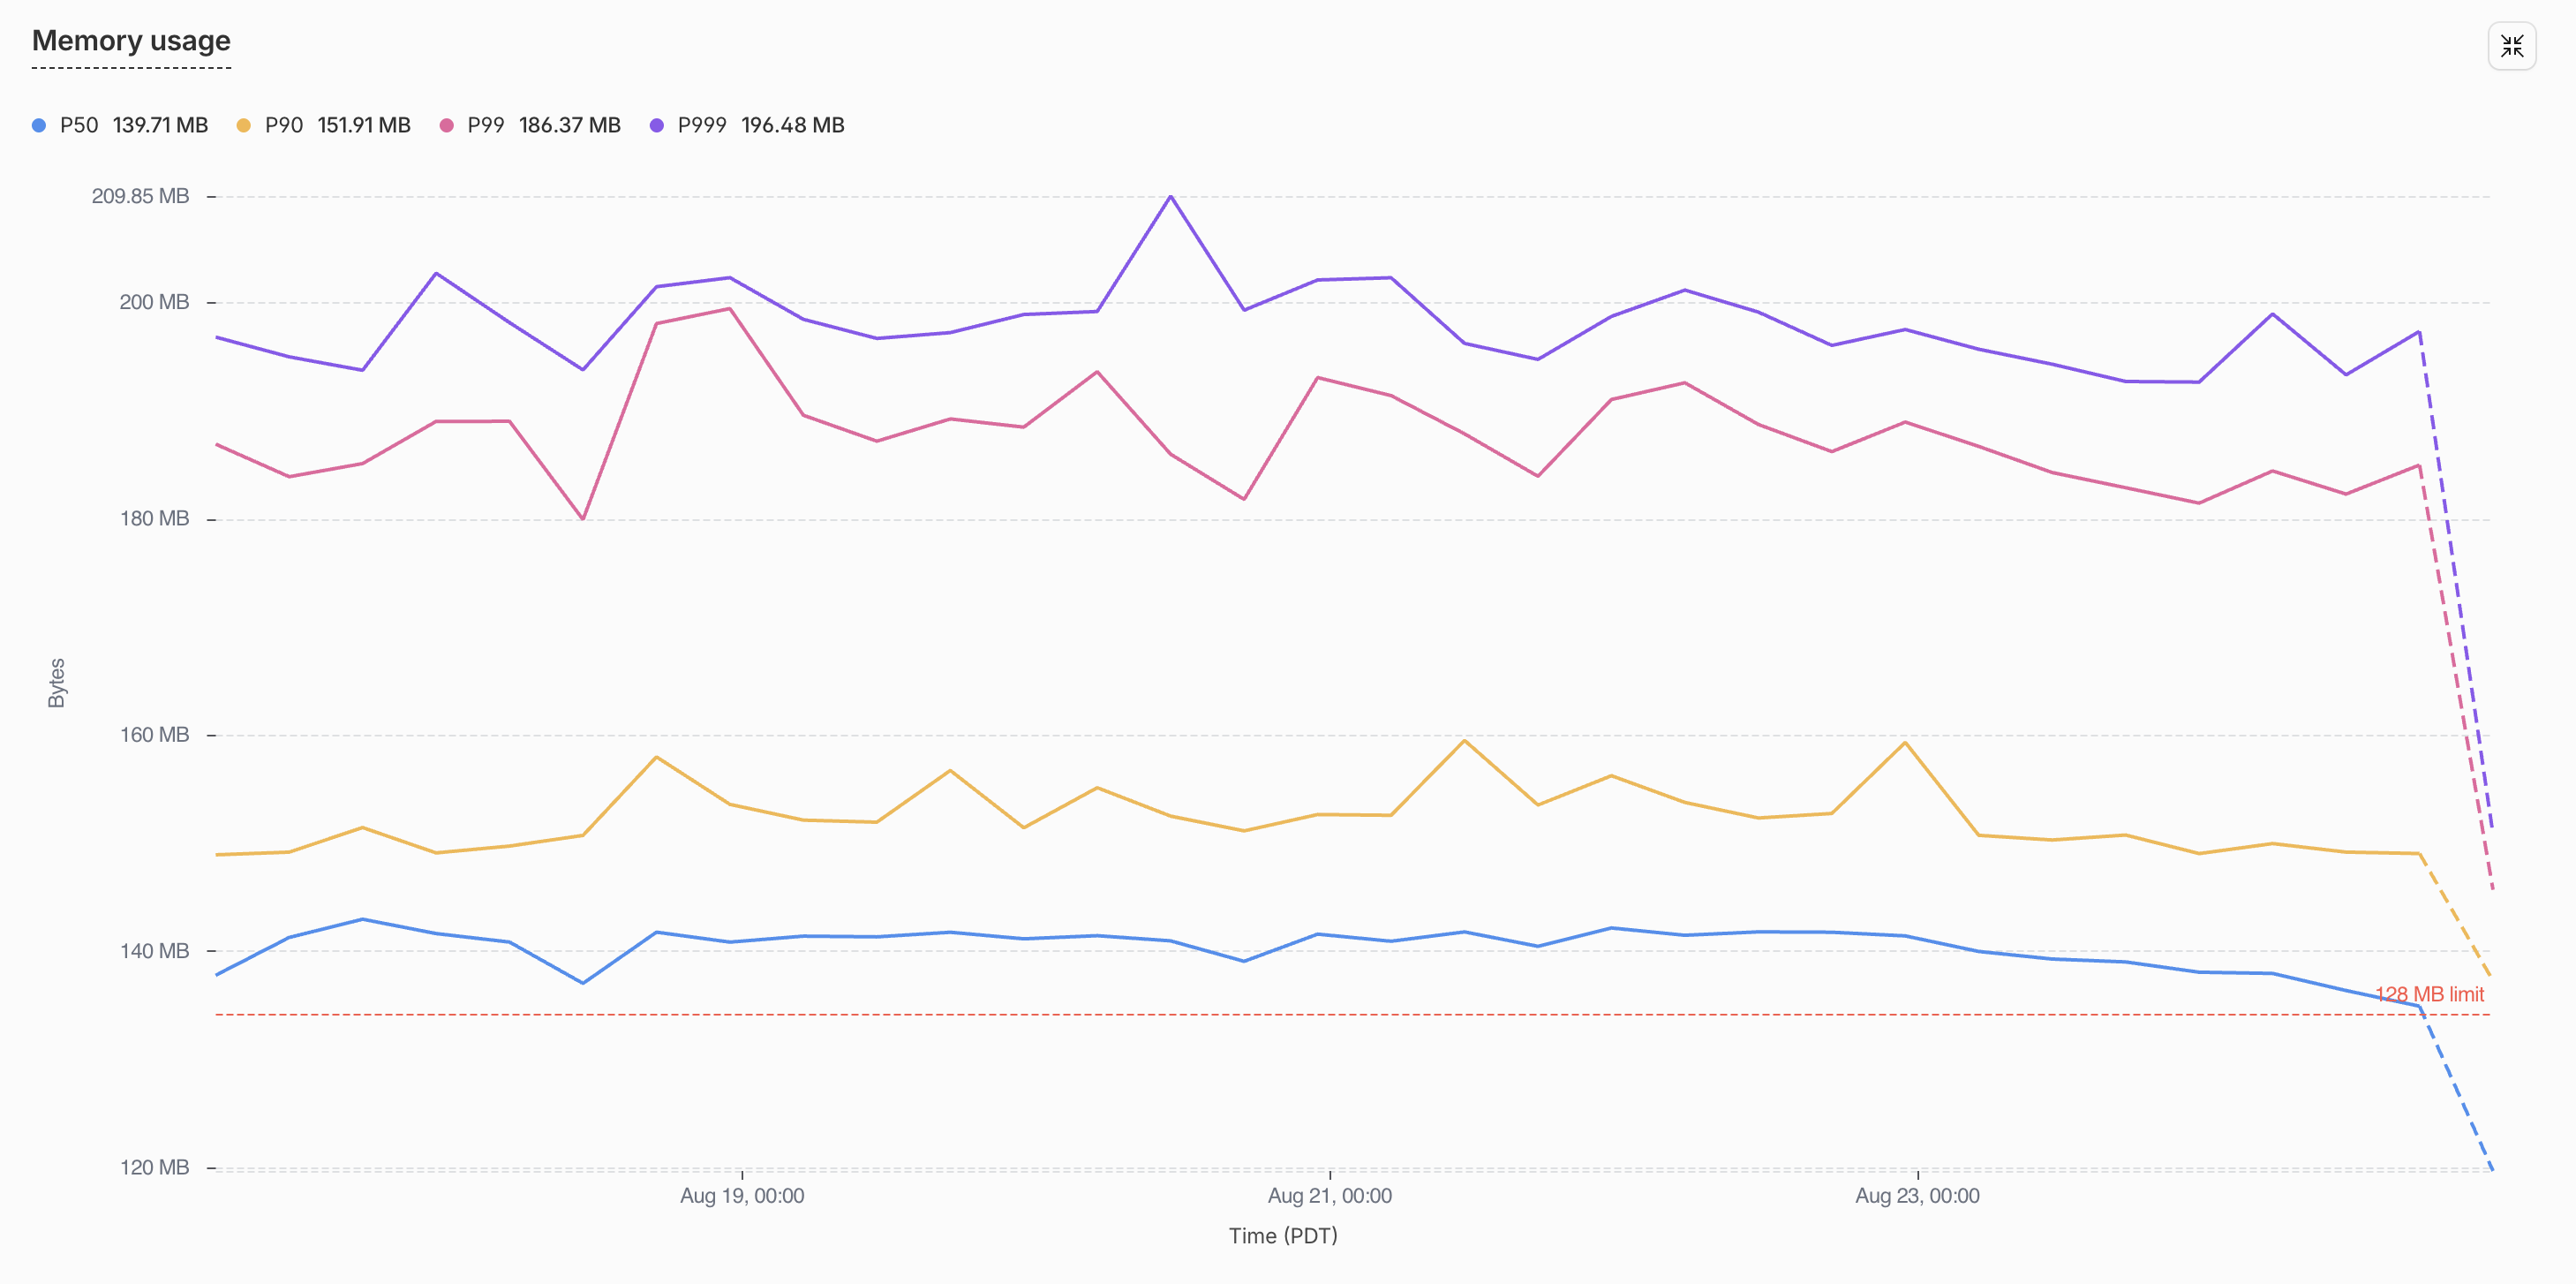
中位隔离区,也就是图1中的蓝线,整周都停在约140 MB,第99百分位停在接近190 MB。两条线都高于虚线标出的128 MB限制,这意味着命名空间中典型的隔离区已经越过了Cloudflare有权重置它的那个点,只是在下一次分配把它推过去之前暂时幸免。曲线没有显示出的,是与流量的任何关系。这条线在安静时段和繁忙时段一样平,每天大约300次重置中没有一次带堆栈跟踪,因为抛出异常的从来不是我们的代码。
我们先看了你会首先想到的地方。我们读了负载大小,检查了聊天历史如何截断,在内存曲线中搜索请求模式,没有发现任何能让这条线移动的东西。这种平坦最终成了重要线索。隔离区的内存只能是两种东西之一:要么是数据,即请求负载、聊天历史、工具输出和任何在处理流量时分配的东西;要么是基线,即代码本身在模块加载时创建并在隔离区整个生命周期内保持存活的对象,比如导入、函数和schema。数据随请求起落,而基线在第一个请求之前就在那里且永不消失,所以一条在空闲时又高又平的曲线描述的是基线。问题必然在我们交付的东西里,而不是在我们服务的东西里。
![graph TB
H["Isolate heap"] --> B["Baseline: built at module load"]
H --> D["Data: allocated per request"]
B --> B1["imports"]
B --> B2["tool schemas"]
B --> B3["package barrels"]
D --> D1["payloads"]
D --> D2["chat history"]
D --> D3["tool outputs"]
style B fill:#fee2e2,stroke:#fca5a5,color:#7f1d1d](/diagrams/bf60aa6a.svg)
为什么基线内存如此容易被忽视
基线内存藏在两个你通常不会去看的地方。
第一个是打包器。我们假设tree shaking会移除我们不用的代码,大多数时候确实如此,但esbuild对何时可以剪枝有自己的规则,而它们不是你会猜到的那些规则。一个package.json中没有"sideEffects": false的包完全不会被剪枝。一个惰性求值模块内部的export *也永远不会被剪枝。对包根的动态import()会把每一个导出都标记为已使用。我们会在修复部分回到这三点,因为它们解释了130 MB中的一半。
// Three ways to keep every zod schema in a package alive in the isolate,
// none of which look like a mistake.

// The package has no "sideEffects": false, so nothing in it is pruned.
import { getWorkspaceStub } from "@scope/durable-workspaces";

// Inside a lazily evaluated module, export * is never pruned.
export * from "./zod";

// A namespace object marks every export as used, schemas included.
const pkg = await import("@scope/durable-workspaces");
第二个是schema库。类型感觉是免费的,因为它们在编译时就消失了,但zod schema不是类型,它是一棵在模块求值那一刻构建的闭包树。一个中等大小的zod 4对象schema,十几个带描述和精化的字段,要花约134 KB的堆。一个光秃秃的z.string()要花约12 KB。等价的普通JSON schema对象只花几百字节。这些都不在README里。
// What each of these costs the moment its module evaluates.
const Params = z.object({                     // ~134 KB for a dozen fields like these
  owner: z.string().describe("Repository owner"),
  repo: z.string().describe("Repository name"),
  pullNumber: z.number().int().describe("PR number"),
});
const Name = z.string();                      // ~12 KB

const params = {                              // a few hundred bytes
  type: "object",
  properties: { owner: { type: "string" }, repo: { type: "string" } },
} as const;
我们没做任何奇特的事
我们的每一个问题都来自一个默认做法。每个智能体工具都在模块作用域用z.object()声明它的输入,因为文档就是这么写的。每个内部包都有一个带export * from "./zod"的桶文件index.ts,因为这样整洁。少数路径用了await import("@scope/package"),因为惰性加载理应更省。每一个单独看都是合理的选择。合在一起它们就是130 MB,在一个只有128可花的隔离区里。
// packages/tools/src/github/get-pull-request.ts, and 250 more like it
export const parameters = z.object({
  owner: z.string().describe("Repository owner"),
  repo: z.string().describe("Repository name"),
  pullNumber: z.number().int().describe("PR number"),
});

// packages/thread-core/src/index.ts, and every other internal package
export * from "./zod";
export * from "./thread";

// packages/durable-threads/src/agent.ts
const { getWorkspaceStub } = await import("@scope/durable-workspaces");
它让我们付出了什么代价
我们的智能体有超过250个工具,通过code mode和动态worker使用它们。仅它们的zod定义在模块加载时就要花78 MB的堆,超过隔离区预算的一半,花在参数描述上,而它们中任何一个都还没被调用。我们每新增一个工具就要再花约134 KB,无论那个工具是否会运行。
250+ tools × ~134 KB of zod each   ≈  78 MB   evaluated before the first request
128 MB isolate cap − 78 MB = 50 MB left for every thread's actual data重置也不是免费的。每一次exceededMemory都会丢掉一个进行中的智能体回合:一次重试、第二次模型调用、一个盯着加载动画的用户。每天约300次,这就不再是一次故障,而是一项常设税,而且由于同址部署,谁碰巧在那一刻处于该隔离区,就由谁来交这笔税。
Error: Durable Object's isolate exceeded its memory limit and was reset.我们如何找到它:一个针对生产bundle的堆分析器
我们无法对生产环境做性能剖析,所以我们构建了一个小型分析器,在本地针对生产环境运行的那个确切bundle运行。它测量求值每个模块的V8堆开销,并打印一张排序表。我们循环运行它:剖析,移除排名顶部的项,再剖析。每个修复的最终检验是一次生产部署,对比部署标记两侧Cloudflare的内存指标。
![graph TB
A["wrangler deploy --dry-run"] --> B["production bundle + metafile"]
B --> C["instrument the __esm helper"]
C --> D["run under Node with stubs"]
D --> E["exclusive heap per module"]
style E fill:#d1fae5,stroke:#6ee7b7,color:#065f46](/diagrams/0b647474.svg)
三个想法让它成立:
- 同一个bundle。
wrangler deploy --dry-run --outdir --metafile会输出一次部署将要上传的那个确切的esbuild bundle,以及它的模块图。一切都在这个bundle上测量。 - **模块归属。**esbuild把惰性求值的模块包在
__esm(...)初始化闭包里。我们在构建好的bundle中重写这一个辅助函数,让每个模块的初始化在自身前后记录v8.getHeapStatistics().used_heap_size,并用一个初始化栈把模块自身的开销(独占)与其依赖的开销(含依赖)分开。结果是一份火焰图形状的数据集。 - **受控运行。**被注入的bundle在普通Node下运行,配合一个把
cloudflare:*导入解析为stub的加载器垫片。
完整的配方在本文末尾,可以直接粘贴给编程智能体。上面引用的zod单位开销来自通过同一harness运行的微基准测试。
第一次剖析显示了什么
| 来源 | 独占堆 |
|---|---|
packages/tools(250+个智能体工具定义,zod) | 78.0 MB |
| 重新导出zod schema模块的包桶文件(下面各行) | ~66 MB |
durable-workspaces(工作区状态和计划) | 15.6 MB |
thread-core(线程数据层) | 10.1 MB |
durable-automations(自动化定义) | 9.6 MB |
durable-threads(线程列表和实时更新) | 7.3 MB |
durable-automation(单次自动化运行) | 6.8 MB |
db(D1客户端和模型) | 6.3 MB |
durable-skills(技能定义) | 5.7 MB |
durable-autofixes(自动修复分支和合并) | 4.9 MB |
| 12个更小的包 | ~9 MB |
第二行是令人意外的那一行。那些是仅通过包桶文件中的export * from "./zod"进入bundle的schema。我们的代码从未使用过它们,tree shaker无法移除它们,而它们花掉了内存限制的三分之一,全都在从未被任何东西调用的模块里。
修复A:把工具定义写成数据,而不是代码
每个工具定义都用zod声明输入schema,并在运行时转换为JSON schema,因为模型收到的本来就是JSON schema。我们为每个工具构建约134 KB的闭包,只为产出几百字节的数据,所以我们直接写数据。
![graph TB
Z["zod schema, ~134 KB per tool"] --> J["toJSONSchema() at runtime"]
J --> M["JSON schema sent to the model"]
D["JSON schema, ~0.3 KB per tool"] --> M
style Z fill:#fee2e2,stroke:#fca5a5,color:#7f1d1d
style D fill:#d1fae5,stroke:#6ee7b7,color:#065f46](/diagrams/5f84b543.svg)
// before: ~134 KB of closures per tool, built at module load
export const parameters = z.object({
  owner: z.string().describe("Repository owner"),
  repo: z.string().describe("Repository name"),
  pullNumber: z.number().int().describe("PR number"),
});

// after: a few hundred bytes of data, and the type comes from the schema
export const parameters = defineParameters({
  type: "object",
  properties: {
    owner: { type: "string", description: "Repository owner" },
    repo: { type: "string", description: "Repository name" },
    pullNumber: { type: "number", description: "PR number" },
  },
  required: ["owner", "repo", "pullNumber"],
} as const);
export type Input = ParametersInput<typeof parameters>;defineParameters是AI SDK的jsonSchema()之上的一层薄封装。ParametersInput是json-schema-to-ts在做zod过去做的类型推断。运行时校验移到了一个约300行的校验器里,它复现了智能体循环所依赖的那些特性:剥除未知键、填充默认值、按判别字段解析联合类型,以及措辞得让模型能在重试时自行修复工具调用的错误信息。
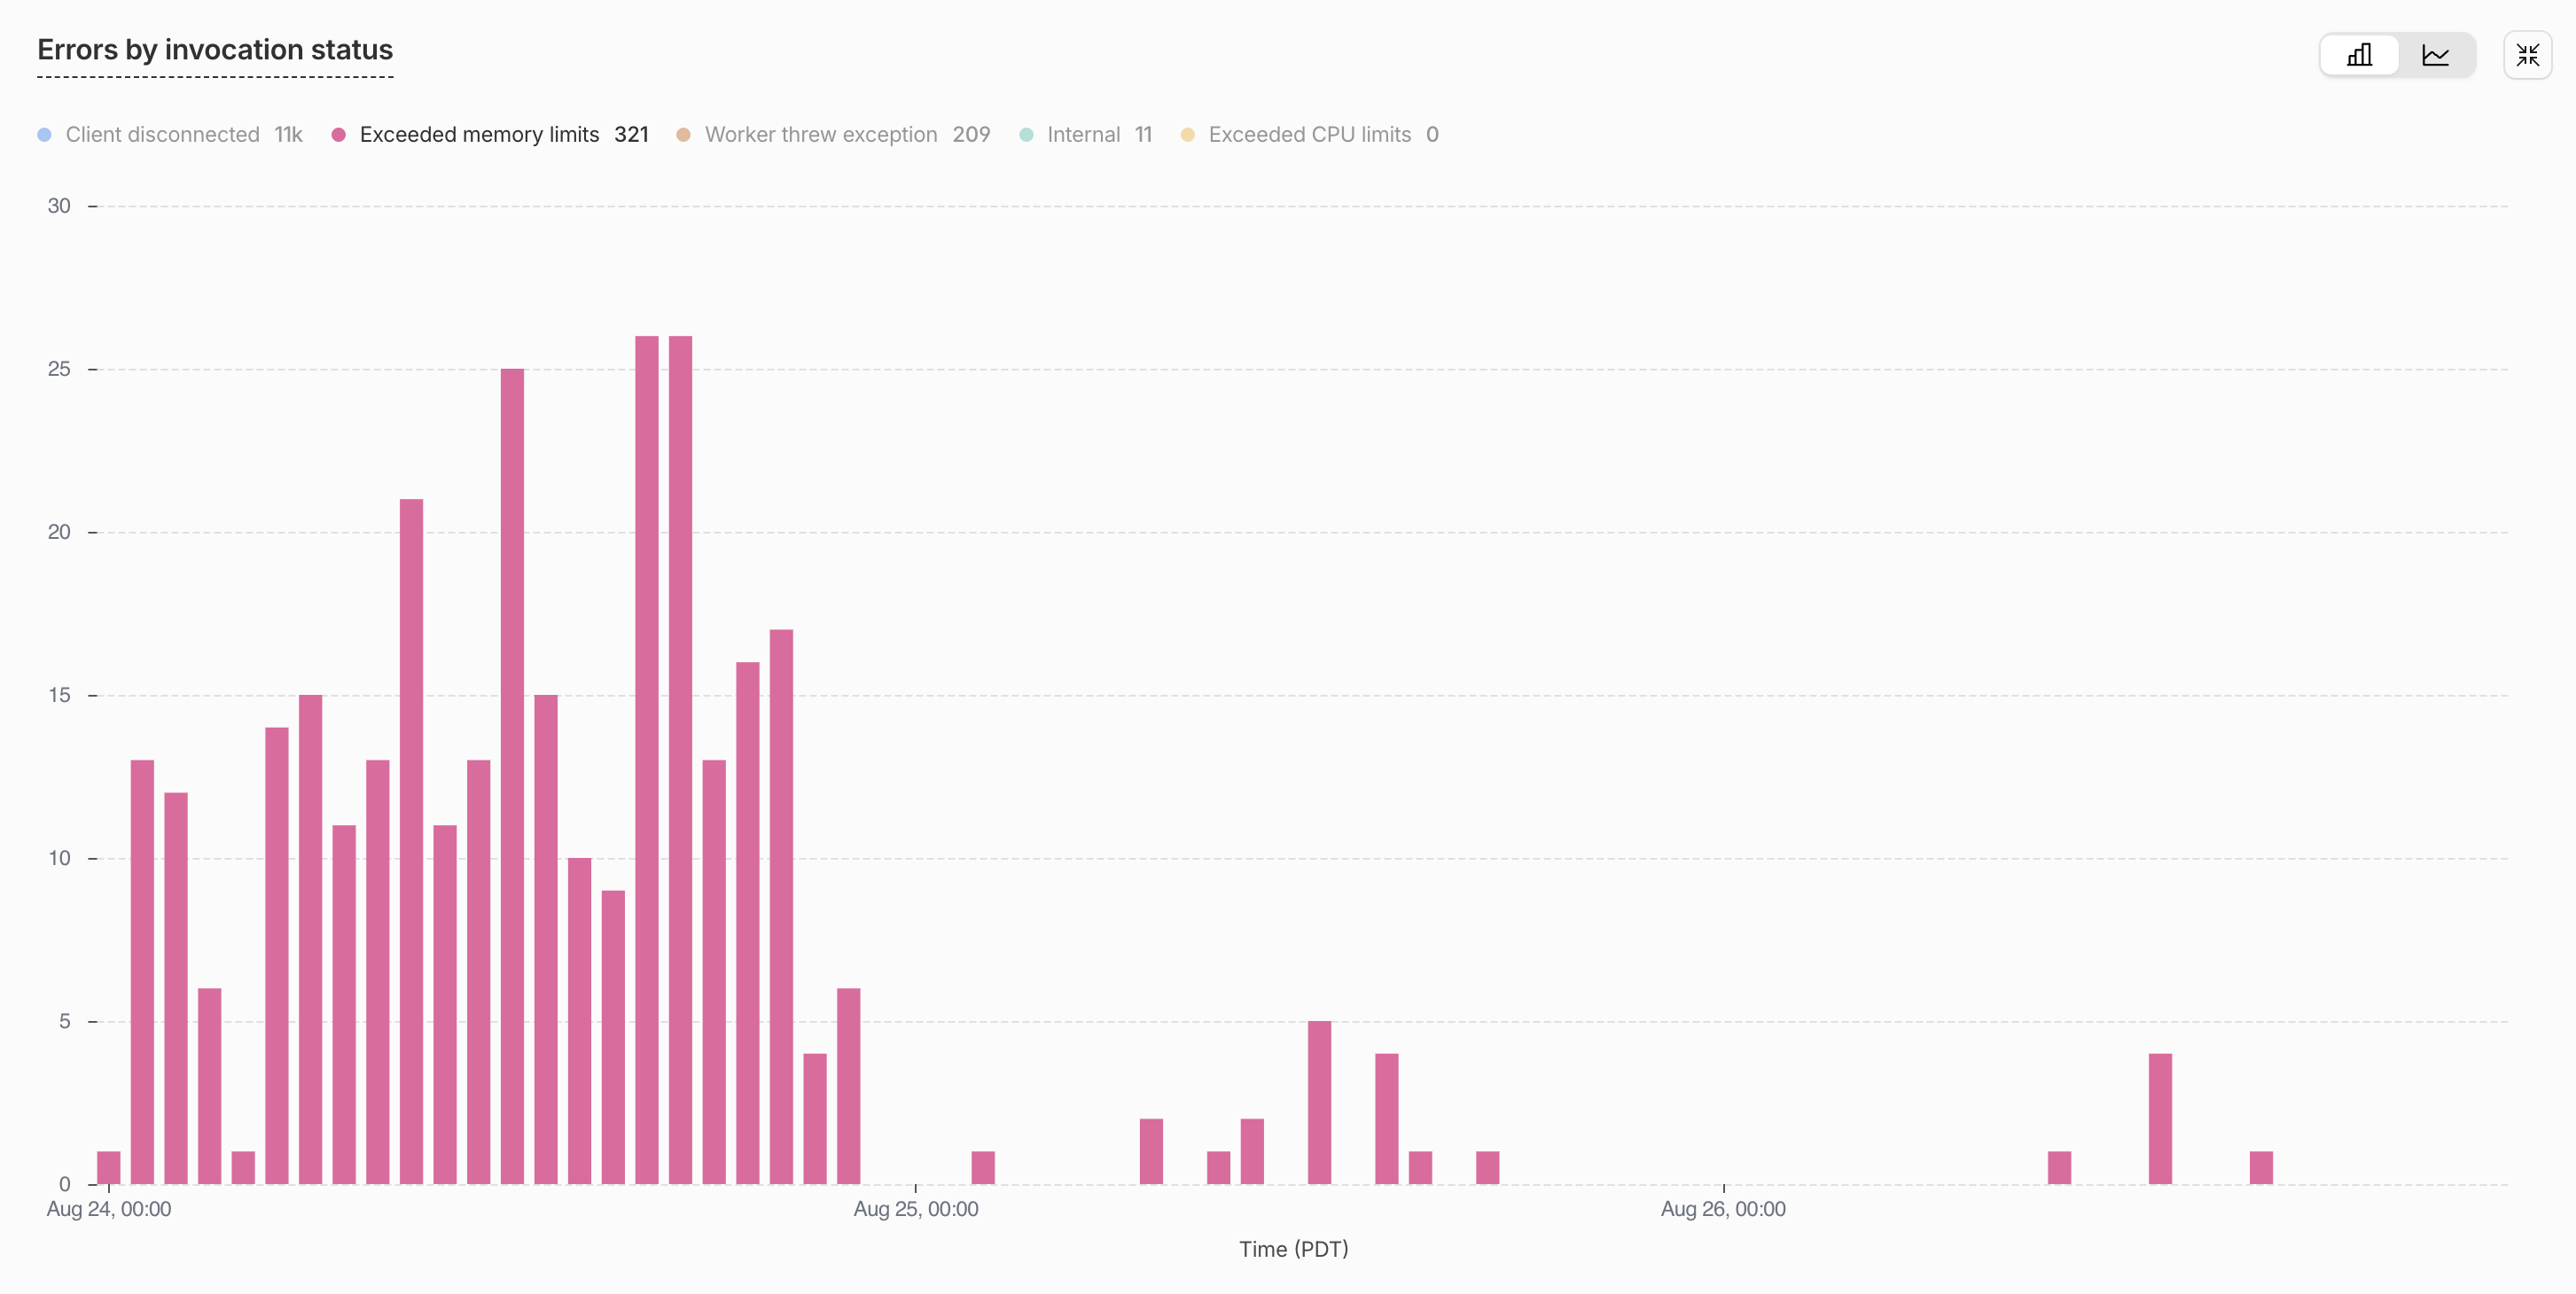
本地的模块求值堆从218.6 MB降到154.0 MB,packages/tools从78 MB降到0.7 MB。在生产环境中,重置在部署标记处从每小时40到110次降到每小时0到6次,中位隔离区内存从约140 MB降到约120 MB。
修复B:真正能被tree-shake的桶文件
剩下的约66 MB是隔离区从未使用的schema。三种打包器行为解释了它:
- 包的
package.json中没有"sideEffects": false时,esbuild不会从中剪掉任何东西。 - 即使有这个标志,惰性求值模块内部的
export * from "./zod"也永远不会被剪枝,而任何通过动态import()可达的东西都是惰性求值的。命名重新导出(export { zFoo } from "./zod")可以正常剪枝。 await import("@scope/package")会实体化该包的整个命名空间对象,把每一个导出都标记为已使用:schema、类,一切。
我们用wrangler内嵌的那个esbuild版本构建了一个五文件夹具来逐条确认:一个入口、一个带index.ts桶文件的包、一个持有单个schema且其构造函数在运行时会宣告的zod.ts、一个导入该schema的do.ts类,以及两者之间的一个惰性中间模块。表格记录了每种组合下schema的构造函数是否在求值时运行。
| 入口导入桶文件的方式 | 桶文件重新导出形态 | sideEffects: false | schema是否被包含 |
|---|---|---|---|
| 静态导入 | export * | 是 | 否 |
| 静态导入 | export * | 否 | 是 |
对包的动态import() | 任意 | 是 | 是 |
| 来自惰性加载模块的静态导入 | export * | 是 | 是 |
| 来自惰性加载模块的静态导入 | 命名列表 | 是 | 否 |
| 任意 | 命名列表 | 否 | 是 |
第3行和第4行是让人意外的两行,它们合起来贡献了那约66 MB。下面是一个桶文件对我们做的事:
![graph TB
A["do.ts imports one function"] --> B["durable-workspaces barrel"]
B -->|"export * from './zod'"| C["zod/*.ts, 15.6 MB of schemas"]
B -->|"used"| D["getWorkspaceStub(), ~1 KB"]
style C fill:#fee2e2,stroke:#fca5a5,color:#7f1d1d
style D fill:#d1fae5,stroke:#6ee7b7,color:#065f46](/diagrams/5d71e80c.svg)
修复是机械性的:在全部110多个工作区包中加上"sideEffects": false,把桶文件的export *改写为命名重新导出列表,并把对包根的await import("@scope/package")替换为静态命名导入。
在真实生产bundle上的消融实验表明每一部分都是必要的。
| 配置 | 模块求值后的堆 | bundle中的schema模块数 |
|---|---|---|
| 基线(修复A之后) | 154.0 MB | 77 |
仅sideEffects: false | 143.6 MB | 77 |
+ 静态导入,桶文件恢复为export *(对照) | 98.6 MB | 29 |
| + 命名重新导出列表(完整修复) | 82.1 MB | 0 |
对照行是有意思的那一行:即使一张完全静态的导入图也保留了29个schema模块,所以命名列表不是可选项。
最终状态
| 模块作用域堆(本地探针) | 生产中位内存 | 生产重置次数 | |
|---|---|---|---|
| 修复前 | 218.6 MB | ~140 MB | ~300/天 |
| 修复A后 | 154.0 MB | ~120 MB | ~10/天 |
| 修复A+B后 | 82.1 MB | ~70 MB | 0 |
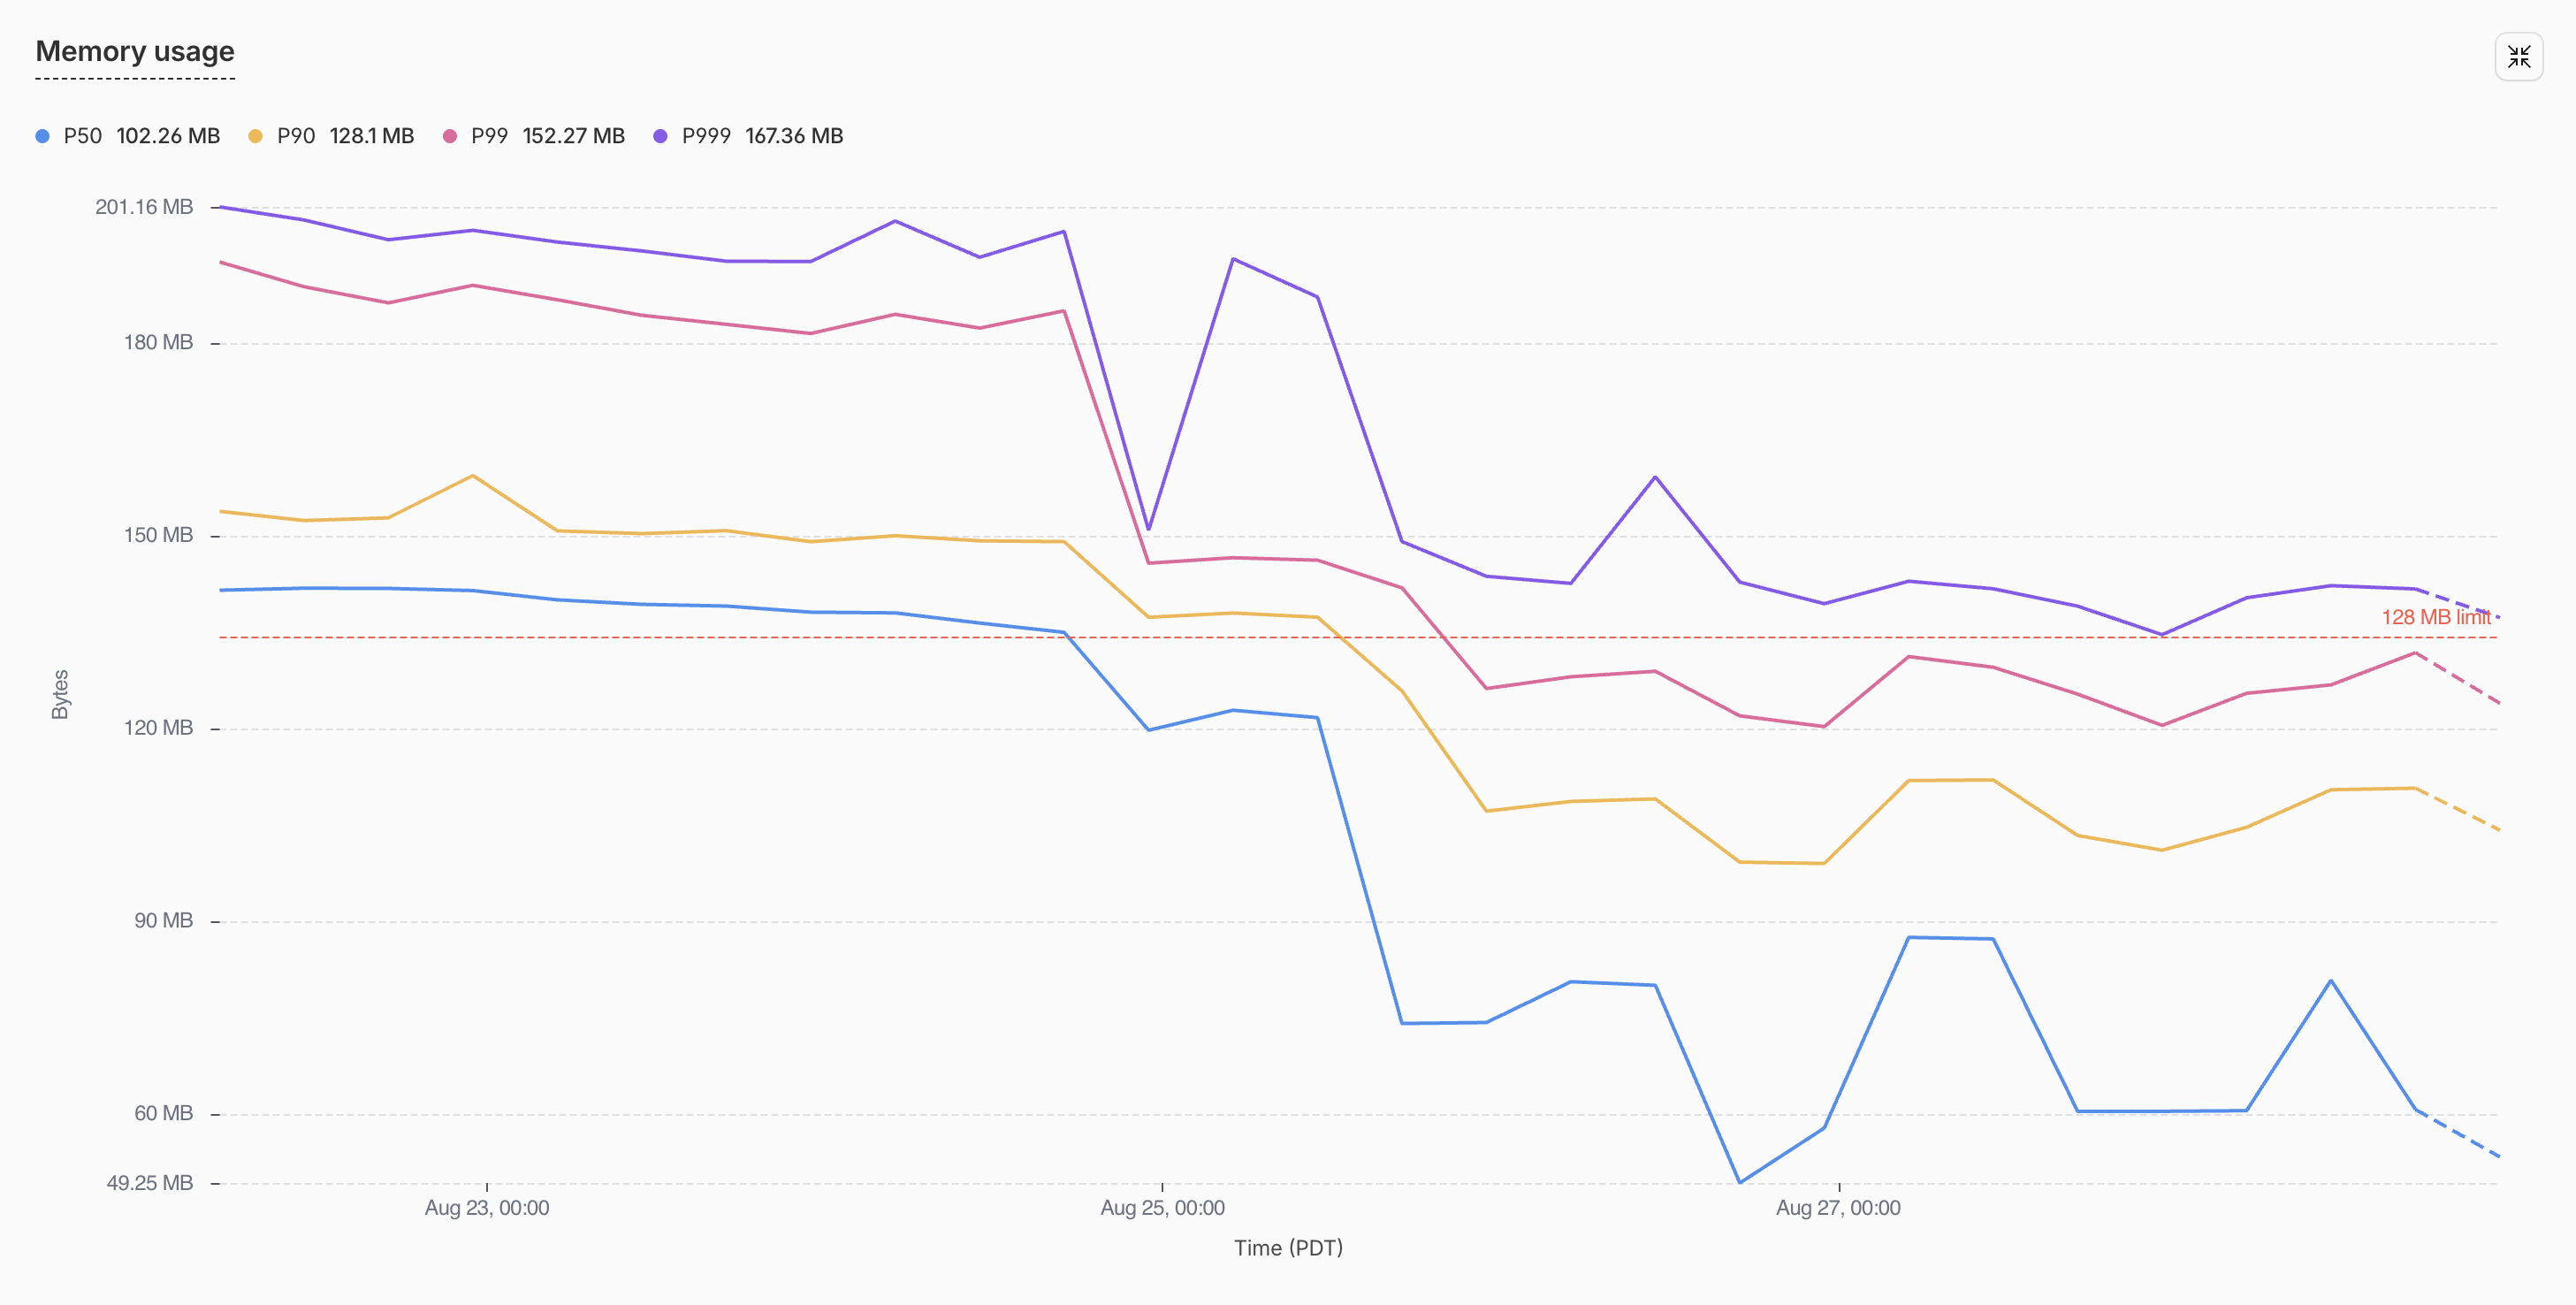
一个空闲时就高于平台内存限制的Durable Object,现在空闲时只用到限制的一半左右,每天约300次的重置也消失了。
这不是一个配置开关
把250多个工具定义从zod改写为原始JSON schema,并写一个300行的校验器来替代zod为我们做的事,即使有编程智能体也花了几天。给100多个包加上sideEffects: false,把每一个export *变成生成的命名列表,是不光彩的活,之后你还要对整个仓库做类型检查并修好坏掉的地方。省事的替代方案是加一个重试然后与重置共存,很多团队确实这么做。如果你的Durable Object在空闲时离限制不远,我认为这一周是值得的,因为限制不会移动,而你的工具数量只会上升。
三件我希望从第一天就知道的事:
- **空闲时又高又平意味着基线。**剖析你交付的东西,而不是你服务的东西。
- tree shaking有规则。
sideEffects: false、命名重新导出、静态导入。漏掉一个,整个包就跟着进来。 - **schema是代码,不是类型。**如果消费方要的是JSON schema,就写JSON schema。
今天就动手修复你的Durable Object内存
这个分析器约100行,除了Node和wrangler没有其他依赖。在任何用wrangler部署的仓库根目录,把下面的配方粘贴给你的编程智能体,读一读它打印的表格的前十行,看看里面有什么。然后沿着列表往下做:任何模型本来就以JSON schema形式接收的东西改成普通JSON schema,桶文件加上"sideEffects": false和命名重新导出,包根改为静态导入。
Build a per-module heap profiler for my worker's production bundle.

1. Emit the exact production bundle and metafile:

   cd <worker-dir>
   npx wrangler deploy --dry-run --env <stage> --config wrangler.jsonc \
     --outdir /tmp/heap-probe --metafile /tmp/heap-probe/meta.json

   If the worker's import graph is fully static, esbuild emits no lazy
   `__esm` wrappers and per-module attribution is impossible. In that case
   build from a probe-only entry that reaches the real entry through a
   dynamic import (and satisfies wrangler's Durable Object export check
   with a placeholder class):

   // probe-entry.ts
   export default { fetch: () => new Response("probe") };
   export class <YourDurableObjectClassName> {}
   export const probeLoad = () => import("<path-to-real-entry>");

   npx wrangler deploy --dry-run --env <stage> --config wrangler.jsonc \
     --outdir /tmp/heap-probe --metafile /tmp/heap-probe/meta.json probe-entry.ts

2. Instrument the bundle. Write instrument.mjs and run
   `node instrument.mjs /tmp/heap-probe`:

   import { readFileSync, writeFileSync } from "node:fs";
   import { join } from "node:path";

   const outDir = process.argv[2];
   const bundlePath = join(outDir, "probe-entry.js"); // or index.js
   const source = readFileSync(bundlePath, "utf-8");

   const esmHelperPattern = /var __esm = \(fn, res(?:, \w+)?\) => function __init\(\) \{[\s\S]*?\n\};\n/;
   if (!esmHelperPattern.test(source)) throw new Error("__esm helper not found; esbuild output shape changed");

   const instrumentedHelper = `var __probeInitStack = [];
   var __esm = (fn, res, err2) => function __init() {
     if (err2) throw err2[0];
     if (!fn) return res;
     const probe = globalThis.__moduleHeapProbe;
     if (!probe) {
       try { return (res = (0, fn[__getOwnPropNames(fn)[0]])(fn = 0)), res; }
       catch (e) { throw ((err2 = [e]), e); }
     }
     const moduleName = __getOwnPropNames(fn)[0];
     const frame = { child: 0 };
     const before = probe.heap();
     __probeInitStack.push(frame);
     try { return (res = (0, fn[moduleName])(fn = 0)), res; }
     catch (e) { throw ((err2 = [e]), e); }
     finally {
       const total = probe.heap() - before;
       __probeInitStack.pop();
       if (__probeInitStack.length > 0) __probeInitStack[__probeInitStack.length - 1].child += total;
       probe.record(moduleName, total - frame.child, total);
     }
   };
   `;
   writeFileSync(join(outDir, "instrumented.mjs"), source.replace(esmHelperPattern, instrumentedHelper));

3. Write a Node loader shim so worker-targeted code loads under Node.
   register.mjs resolves `cloudflare:*` to a stub module (an empty module
   exporting throwing placeholders for DurableObject, WorkerEntrypoint,
   env, etc.) via module.registerHooks; add a `load` hook for any
   non-JS rules in your wrangler config (for us: `.sql` files become
   text default exports, mirroring wrangler's Text rule).

4. Write probe.mjs and run it:

   node --expose-gc --import ./register.mjs probe.mjs /tmp/heap-probe

   import { join } from "node:path";
   import { pathToFileURL } from "node:url";
   import v8 from "node:v8";

   const outDir = process.argv[2];
   const records = [];
   globalThis.__moduleHeapProbe = {
     heap: () => v8.getHeapStatistics().used_heap_size,
     record: (moduleName, exclusive, total) => records.push({ moduleName, exclusive, total }),
   };
   const settle = async () => { await new Promise((r) => setTimeout(r, 0)); globalThis.gc(); globalThis.gc(); };
   const mb = (b) => (b / 1048576).toFixed(2);

   await settle();
   const bundle = await import(pathToFileURL(join(outDir, "instrumented.mjs")).href);
   if (bundle.probeLoad) await bundle.probeLoad();
   await settle();
   console.log(`heap after module evaluation: ${mb(v8.getHeapStatistics().used_heap_size)} MB`);

   for (const r of records.sort((a, b) => b.exclusive - a.exclusive).slice(0, 40))
     console.log(`${mb(r.exclusive).padStart(8)} MB  ${r.moduleName}`);

   const byPackage = new Map();
   for (const r of records) {
     const m = r.moduleName.match(/node_modules\/((?:@[^/]+\/)?[^/]+)|(packages\/[^/]+)/);
     const key = m ? (m[1] ? `npm:${m[1]}` : m[2]) : "other";
     byPackage.set(key, (byPackage.get(key) ?? 0) + r.exclusive);
   }
   for (const [k, v] of [...byPackage.entries()].sort((a, b) => b[1] - a[1]))
     if (v > 131072) console.log(`${mb(v).padStart(8)} MB  ${k}`);

5. Gotchas that will otherwise burn an afternoon:
   - The bundle's unenv polyfill replaces globalThis.process at init and its
     memoryUsage() reports zeros. Read v8.getHeapStatistics() instead.
   - Compare deltas between runs of this probe, never absolutes against
     production: Node's heap baseline differs from workerd's.
   - Modules evaluated eagerly at the top level (not wrapped in __esm) are
     invisible to attribution; the probe-entry trick in step 1 fixes that.
如果你想让整个审计都替你做完,这里有一个给你的编程智能体的技能:
Audit this repo's worker bundles for module-scope schema weight, and fix what you find. Work in this order and show me numbers at every step.

1. Baseline. Using the "profile module-scope heap" recipe, build the
   production bundle of our most memory-sensitive worker and produce the
   per-module and per-package exclusive-heap ranking. Report heap after
   module evaluation.

2. Identify schema weight. From the ranking and the esbuild metafile, list
   every module matching your schema conventions (zod/valibot/etc. modules,
   e.g. packages/*/zod*) that survived into the bundle, with bytes. For each,
   compute one import chain from the entry using the metafile's `imports`
   graph (BFS), so we know *why* it is in the bundle.

3. Classify each surviving schema module:
   a. Actually used at runtime by this worker: leave it, or move the boundary.
   b. Reached through `export *` in a package barrel: candidate for named lists.
   c. Reached through `await import("<package root>")`: candidate for a static
      named import.
   d. Reached because the package lacks `"sideEffects": false`: candidate flag.

4. Apply, in this order, re-profiling after each:
   a. Add `"sideEffects": false` to every internal package that has no
      import-time side effects. Audit first: grep package sources for
      top-level globalThis mutations, addEventListener, polyfill assignment.
      Any true side-effect file gets `"sideEffects": ["./that-file.ts"]`.
   b. Rewrite `export * from "./<schemas>"` in package barrels to explicit
      `export { ... }` / `export type { ... }` lists. Generate the lists with
      the TypeScript compiler API (walk ExportDeclarations recursively,
      classify value vs type), never by regex. Typecheck the repo after.
   c. Replace every value-position `await import("@scope/pkg")` of a bare
      package root with a static named import of the symbols actually used.
      Check the site is not lazy for a *different* reason first (circular
      imports, Node-only test loading, genuine cold-path npm dependency).

5. If tool/LLM definitions build schema-library objects at module scope,
   propose converting them to plain JSON schema with types via
   json-schema-to-ts, and estimate the saving from step 1's ranking before
   doing it.

6. Verify: re-profile (report the delta), typecheck, run the affected
   packages' tests, and dry-run build every worker. Then add a CI assertion
   that reads the metafile of the memory-sensitive worker and fails if any
   schema module survives tree shaking into it, printing the import chain.

7. After deploy, compare the platform memory metrics across the deploy
   marker and report before/after median and 99th percentile memory, and reset
   counts.
我们也把这个技能加进了Polylane本身,所以每一位Polylane用户开箱即可获得对其Durable Object内存的这种深度调查,无需粘贴任何东西。